Fig. 2
Download original image
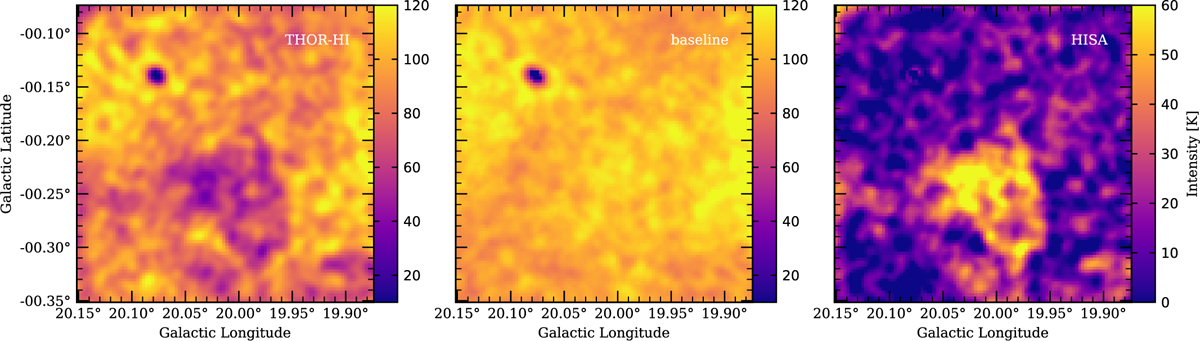
Example H I self-absorption extraction. The left panel shows the observed THOR-H I emission channel map toward a (100 × 100)pixel subsection of the giant filament GMF20.0-17.9 at the velocity 44.5 km s−1. The middle panel shows the map of the self-absorption baseline obtained with optimized smoothing parameters. The right panel gives the resulting HISA map, which is the difference between the baseline map and the H I emission map. The HISA feature in the bottom half of the map could be successfully recovered by astroSaber, while the strong continuum source in the top left was masked during a quality check of the spectra.
Current usage metrics show cumulative count of Article Views (full-text article views including HTML views, PDF and ePub downloads, according to the available data) and Abstracts Views on Vision4Press platform.
Data correspond to usage on the plateform after 2015. The current usage metrics is available 48-96 hours after online publication and is updated daily on week days.
Initial download of the metrics may take a while.