Fig. E.2
Download original image
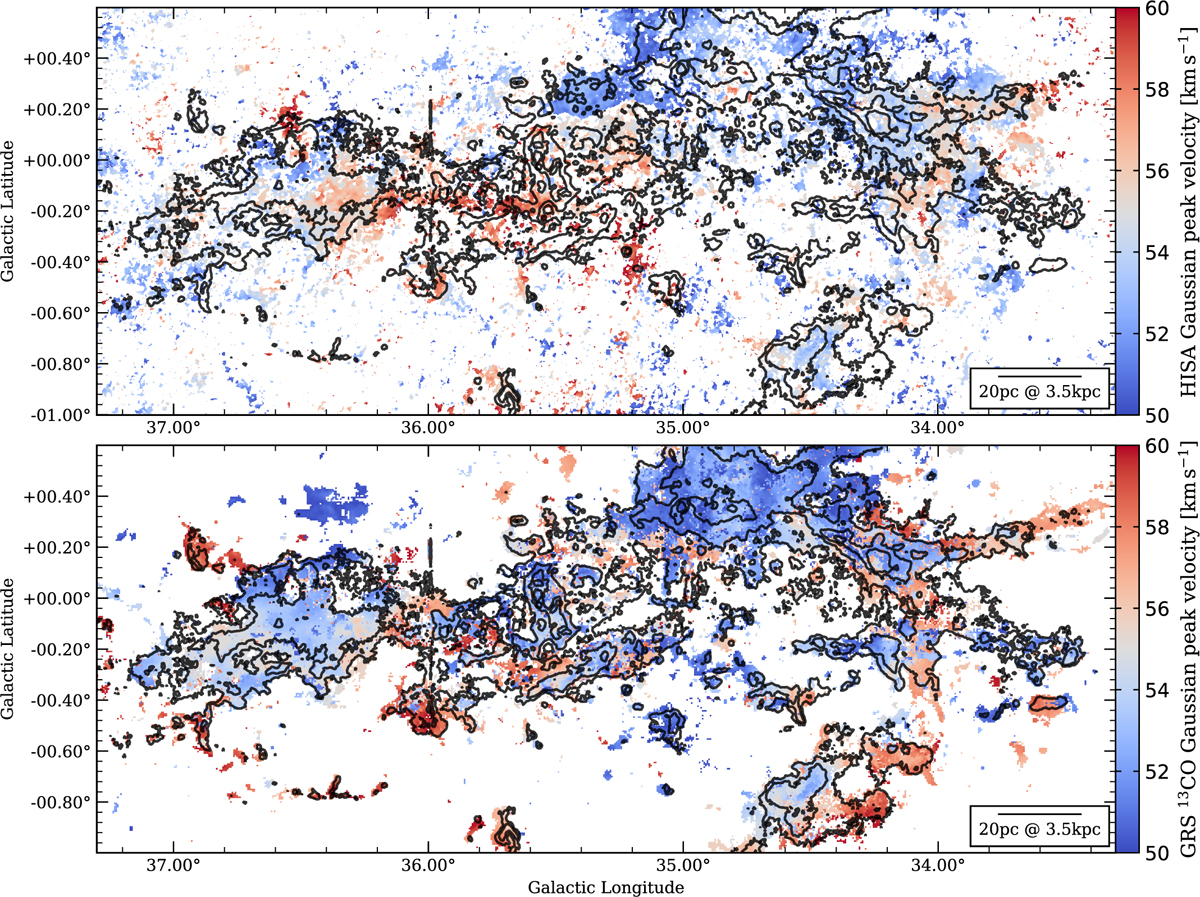
Fit peak velocity toward GMF38a. These maps show the peak velocities of fit components derived from the GAUSSPY+ decomposition of the spectra. If multiple components are present in a single pixel spectrum within the velocity range of the filament region, the component with the lowest peak velocity is shown. The black contours in both panels show the integrated GRS 13CO emission at the levels 5.0, 10.0, 20.0, and 30.0 K km s−1. The contour feature at longitude ℓ = 36° is an artifact in the observational data. Top panel: Fit HISA peak velocity. Bottom panel: Fit 13CO peak velocity.
Current usage metrics show cumulative count of Article Views (full-text article views including HTML views, PDF and ePub downloads, according to the available data) and Abstracts Views on Vision4Press platform.
Data correspond to usage on the plateform after 2015. The current usage metrics is available 48-96 hours after online publication and is updated daily on week days.
Initial download of the metrics may take a while.