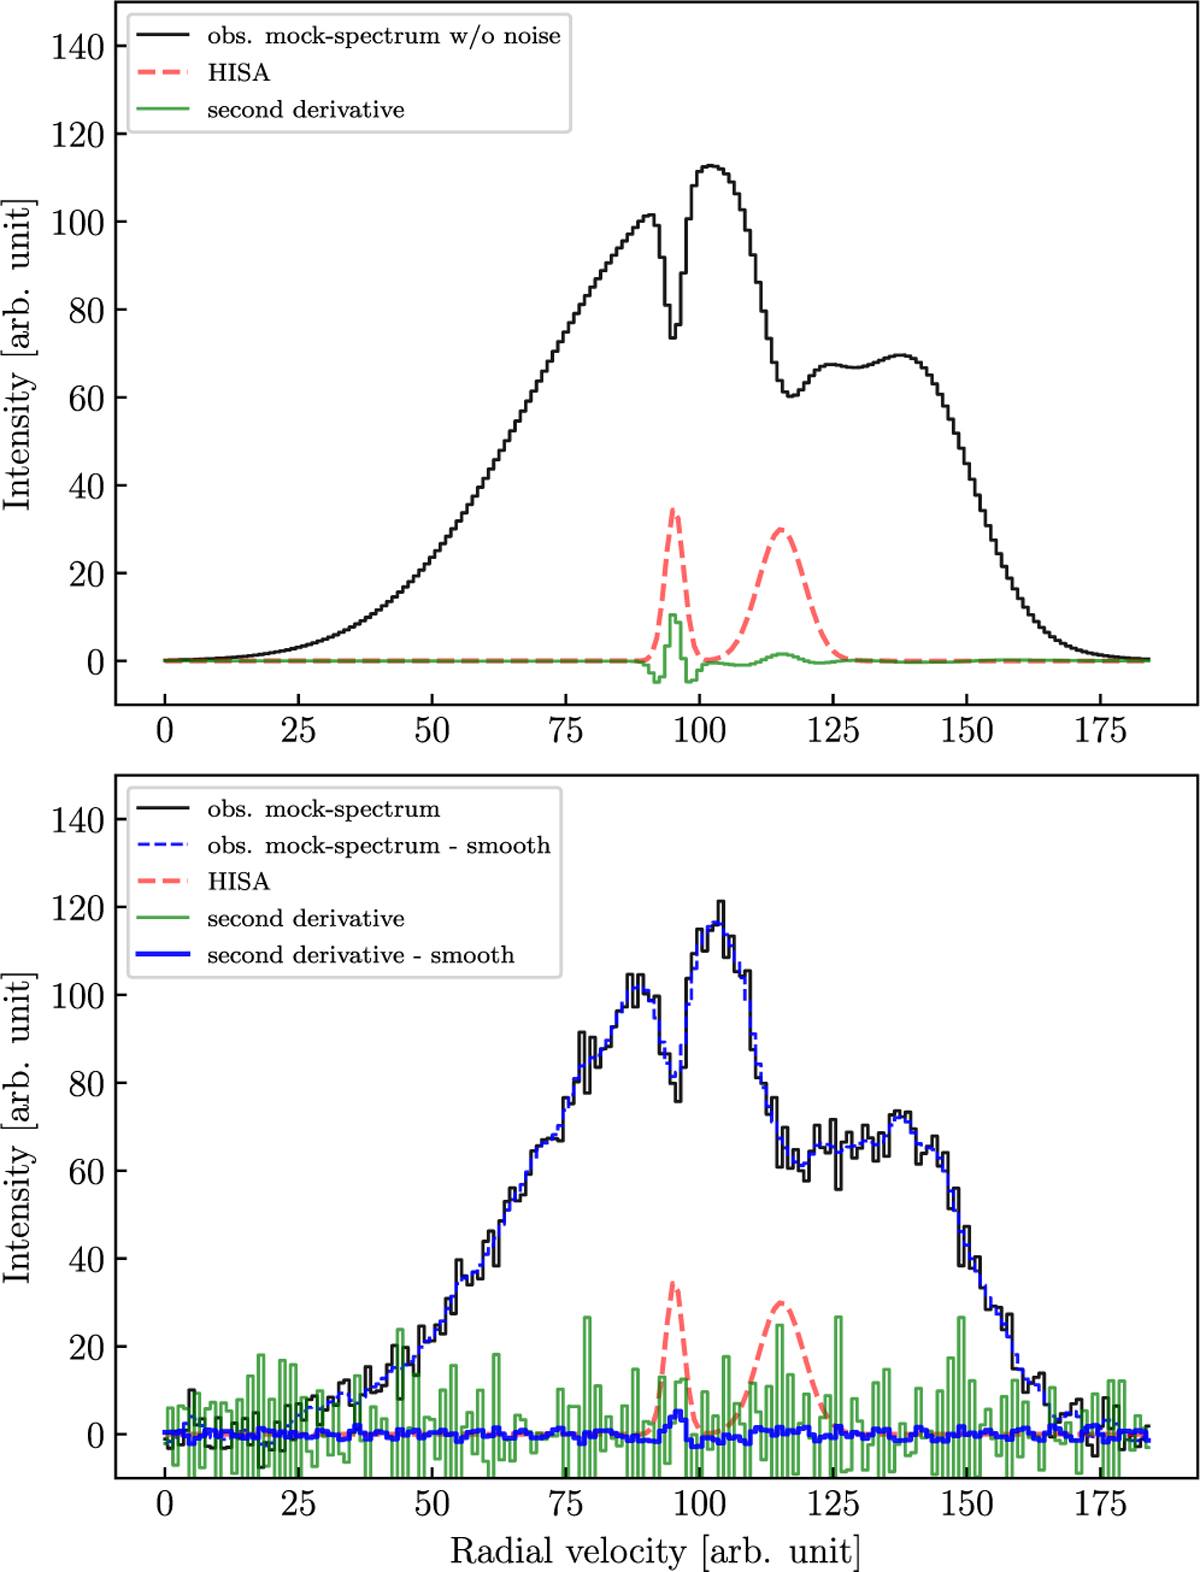
Fig. B.1
Download original image
Second derivative representation as a means to identify self-absorption. Top panel: The black mock spectrum represents the H I emission spectrum, with two self-absorption features superposed (red dashed components) and without any observational noise. The green spectrum shows the second derivative of the black mock spectrum, obtained from the finite differences between spectral channels. Bottom panel: The black mock spectrum represents the H I emission spectrum, with two self-absorption features superposed (red dashed components) and with added noise that is comparable to the noise of the THOR-H I observations (same spectrum as in Fig. 1). The green spectrum shows the second derivative of the black mock spectrum, obtained from the finite differences between spectral channels. The dashed blue spectrum represents a regularized least squares solution to the H I spectrum, which minimizes the second derivative. The corresponding second derivative is shown in blue, which is now less affected by noise fluctuations.
Current usage metrics show cumulative count of Article Views (full-text article views including HTML views, PDF and ePub downloads, according to the available data) and Abstracts Views on Vision4Press platform.
Data correspond to usage on the plateform after 2015. The current usage metrics is available 48-96 hours after online publication and is updated daily on week days.
Initial download of the metrics may take a while.