Fig. 1
Download original image
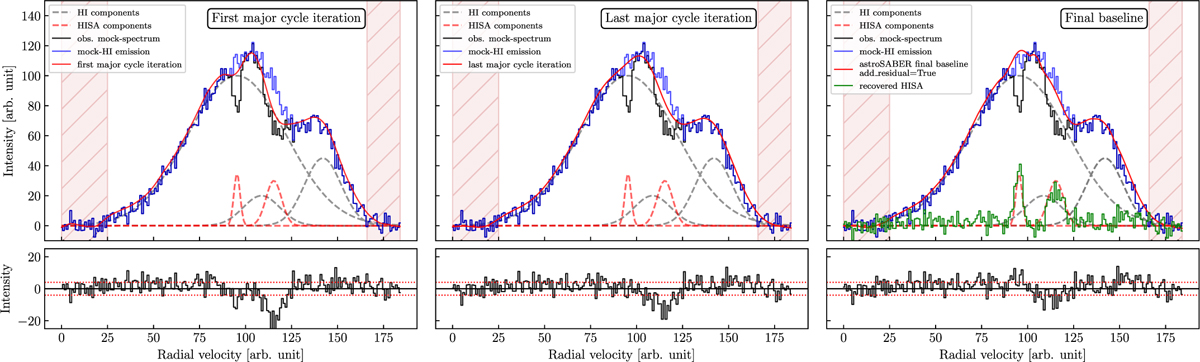
Baseline extraction workflow of astroSABER. In each panel, the black mock spectrum represents the observed H I emission spectrum, which is the sum of the three gray dashed components, with self-absorption features (two red dashed components) superposed. The blue spectrum shows the “pure emission” spectrum that is to be recovered by the astroSABER algorithm. The algorithm is then applied to the observed spectrum using the optimal smoothing parameters (λ1, λ2). Hatched red areas indicate spectral channels that are masked out due to missing signal. Left panel: the astroSABER baseline (red) after the first major cycle iteration, that is, after the minor cycle smoothing converged given the input mock spectrum (i.e., after Eq. (1) has been solved for z). Middle panel: the astroSABER baseline (red) after the last major cycle iteration, that is, after the major cycle smoothing converged and before adding the residual, which is the absolute difference between the first and last major cycle iteration. Right panel: the final astroSABER baseline (red) after adding the residual. The baseline so obtained reproduces the pure emission spectrum (blue) well. The resulting HISA features expressed as equivalent emission features are shown in green, and show a good match with the real HISA absorption features. The smaller subpanels in each column show the residual, which is the difference between the red baseline and the blue emission spectrum, with the horizontal dotted red lines marking values of ±σrms.
Current usage metrics show cumulative count of Article Views (full-text article views including HTML views, PDF and ePub downloads, according to the available data) and Abstracts Views on Vision4Press platform.
Data correspond to usage on the plateform after 2015. The current usage metrics is available 48-96 hours after online publication and is updated daily on week days.
Initial download of the metrics may take a while.