Fig. 4.
Download original image
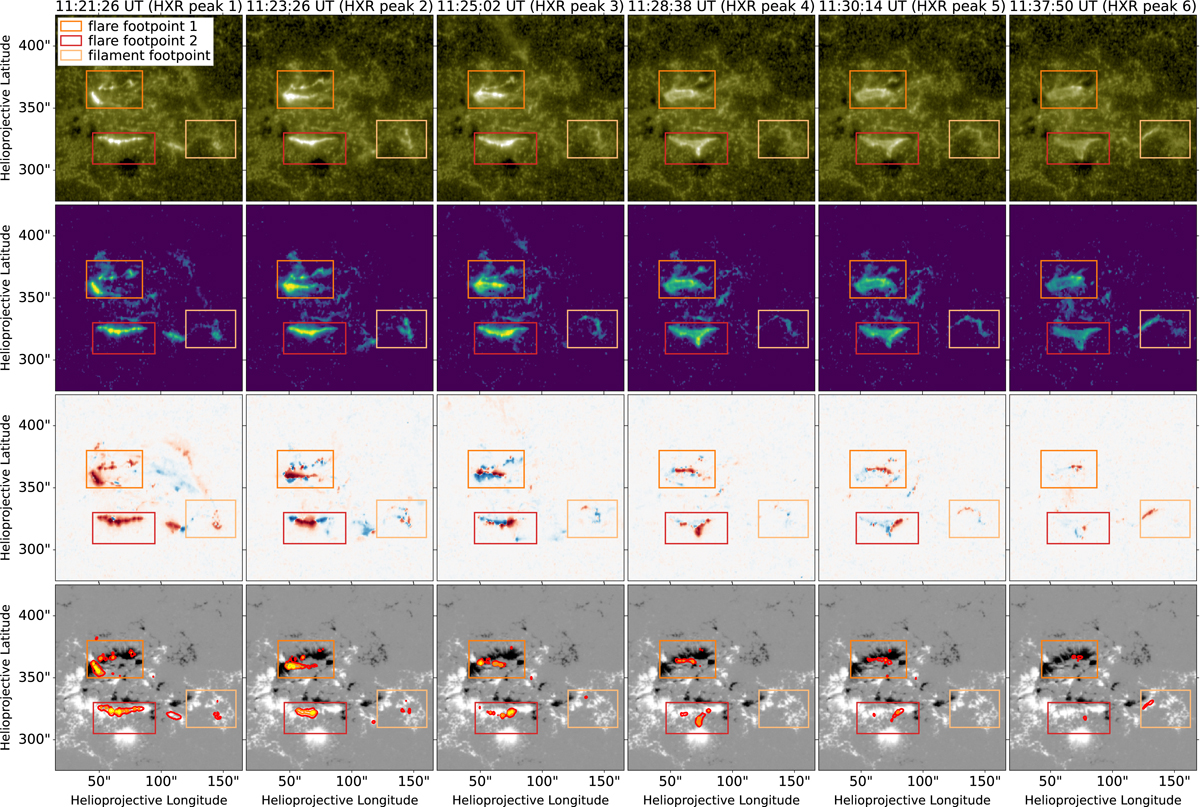
AIA 1600 Å observations and their relation to the HMI LOS magnetic field. Top row: AIA 1600 Å images taken during HXR peaks detected by STIX. The observation times and corresponding HXR peak numbers are given on top. Colored rectangles mark subregions encompassing the northern footpoints of the filament and northern flare ribbon (orange), the southern flare ribbon (red), and the southern filament footpoint (yellow). Second row: base difference images of the frames shown on top relative to the AIA 1600 Å image taken at 11:00 UT. Third row: running-difference images of the above frames relative to the AIA 1600 Å image taken 48 s earlier. Red and Blue indicate positive and negative change, respectively. Bottom row: contours of positive changes (emission increase) in the running difference images above on top of the HMI LOS magnetograms. A movie is available online.
Current usage metrics show cumulative count of Article Views (full-text article views including HTML views, PDF and ePub downloads, according to the available data) and Abstracts Views on Vision4Press platform.
Data correspond to usage on the plateform after 2015. The current usage metrics is available 48-96 hours after online publication and is updated daily on week days.
Initial download of the metrics may take a while.