Fig. 10.
Download original image
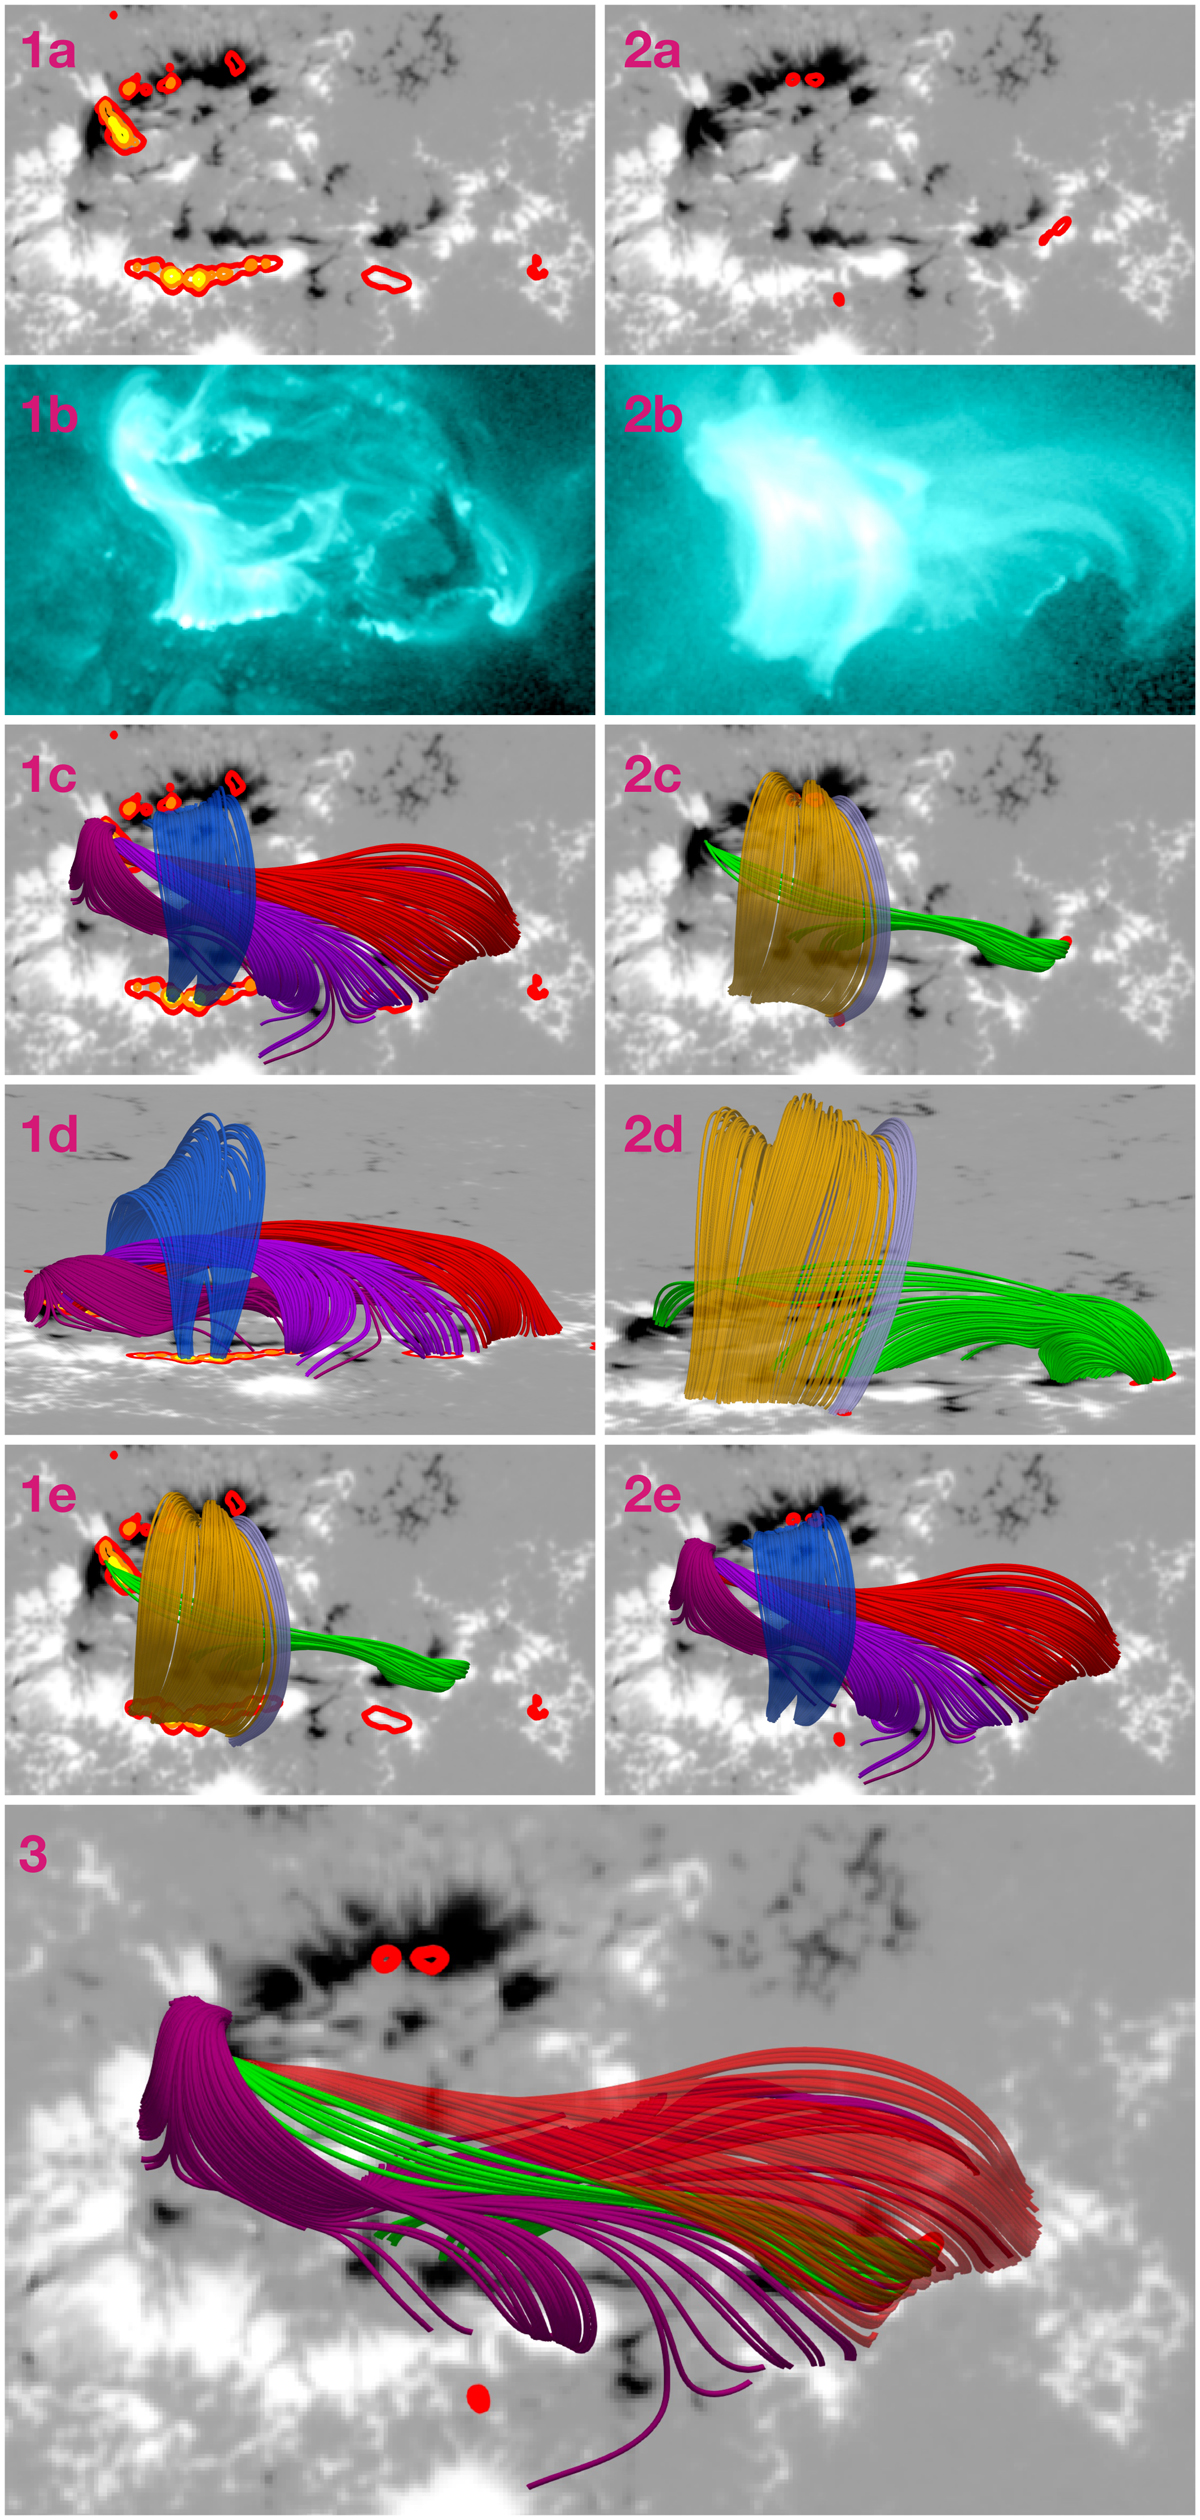
Comparison of pre-flare magnetic field structures involved in the first (1) and last (6) HXR peaks. 1a and 2a: HMI LOS magnetic field with contours of AIA 1600 Å enhancements during HXR peak 1 (left) and 6 (right). See Fig. 4, bottom panels for the intermediate HXR peaks. 1b and 2b: AIA 131 Å images taken during the two HXR peaks. 1c and 2c: selection of the most important field lines. 1d and 2d: side view of the same structure. 1e and 2e: same contours, but the field lines have been swapped. 3: comparison between selected field structures.
Current usage metrics show cumulative count of Article Views (full-text article views including HTML views, PDF and ePub downloads, according to the available data) and Abstracts Views on Vision4Press platform.
Data correspond to usage on the plateform after 2015. The current usage metrics is available 48-96 hours after online publication and is updated daily on week days.
Initial download of the metrics may take a while.