Fig. 2.

Download original image
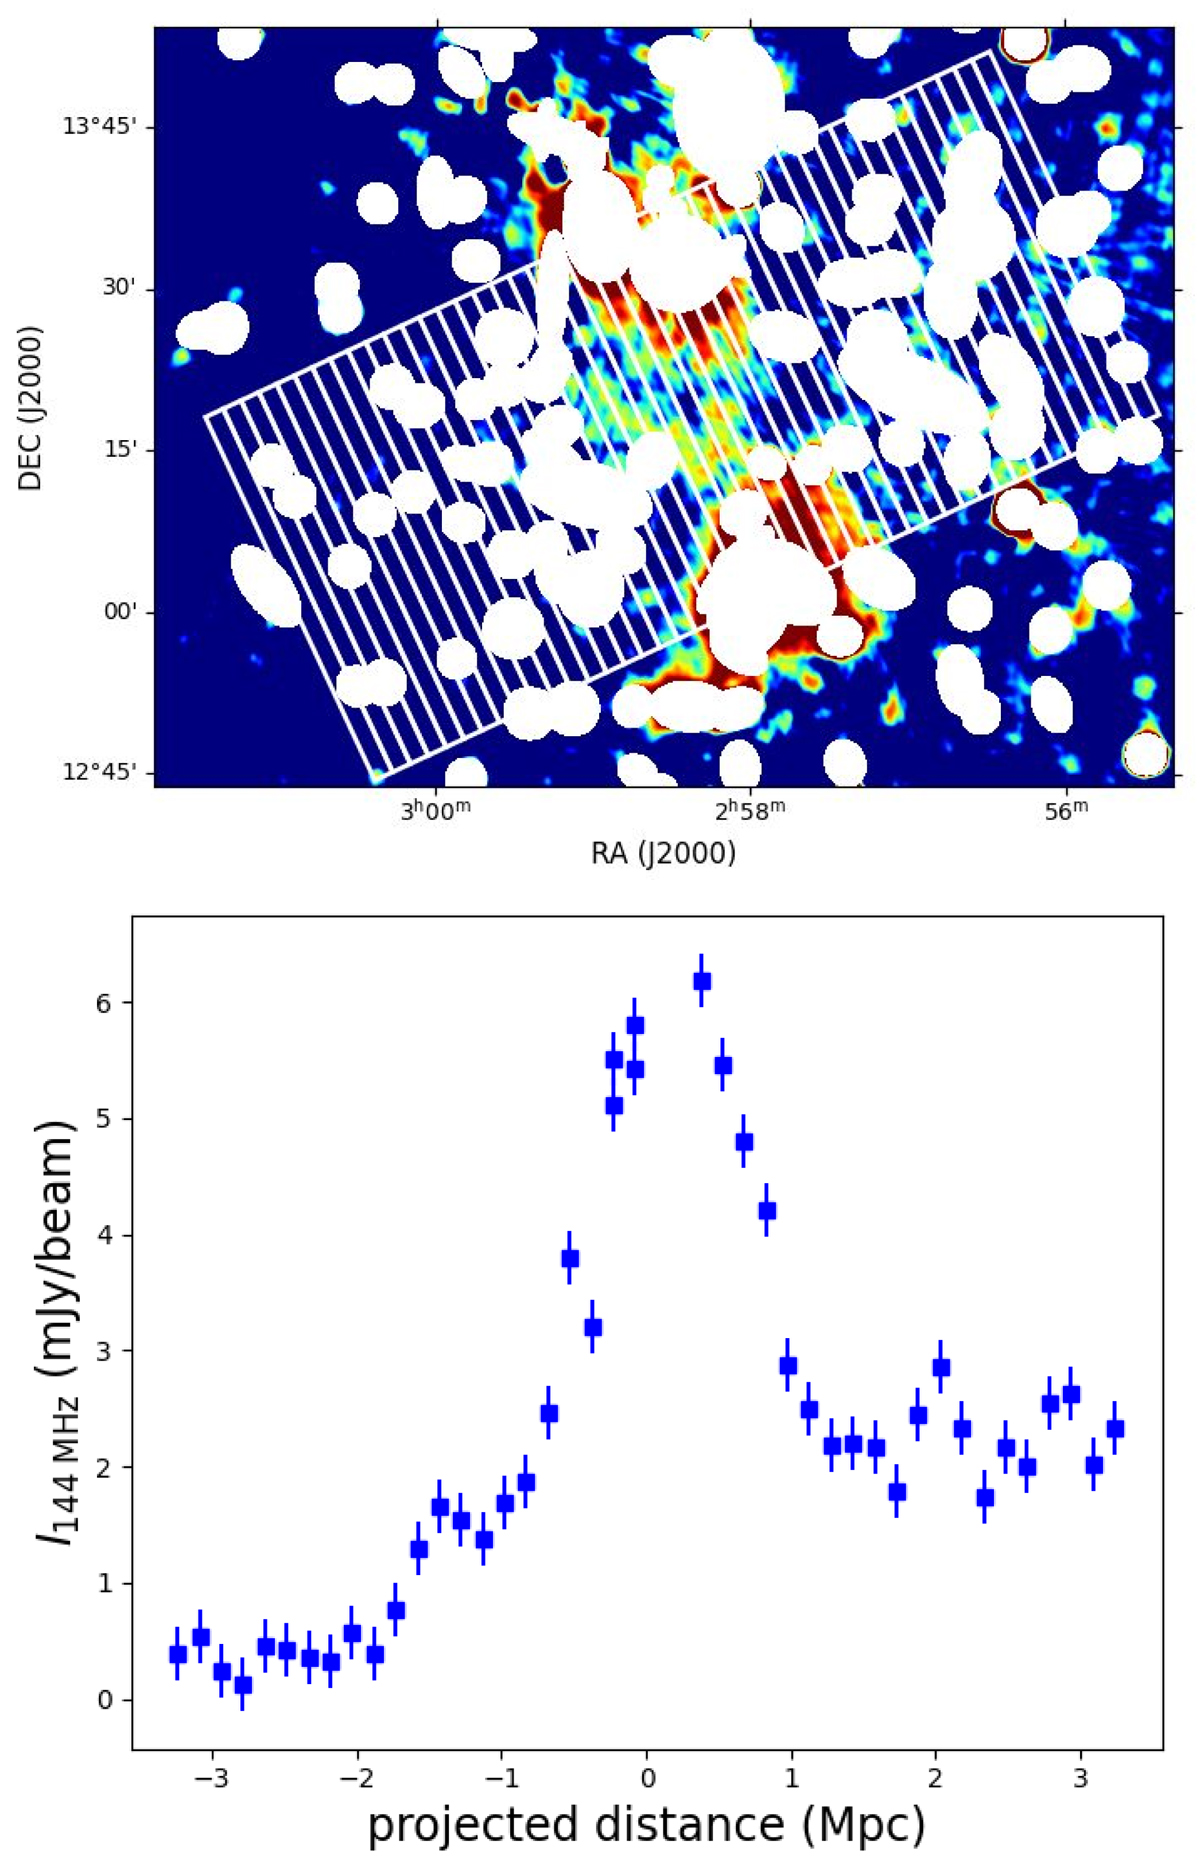
Bridge emission profile after masking of unrelated sources. Upper panel: compact source-subtracted image (see Sect. 4 and Fig. 6) with non-bridge sources masked out (white ellipses). A white line grid is used to measure the bridge brightness profile. The grid is tilted by 25° and has the same reference point (centre) as Govoni et al. (2019). The lines are separated by 144 kpc (one beam width) and their length is 3 Mpc. Lower panel: surface brightness profile extracted by measuring the average surface brightness in each slice.
Current usage metrics show cumulative count of Article Views (full-text article views including HTML views, PDF and ePub downloads, according to the available data) and Abstracts Views on Vision4Press platform.
Data correspond to usage on the plateform after 2015. The current usage metrics is available 48-96 hours after online publication and is updated daily on week days.
Initial download of the metrics may take a while.


