Fig. 7
Download original image
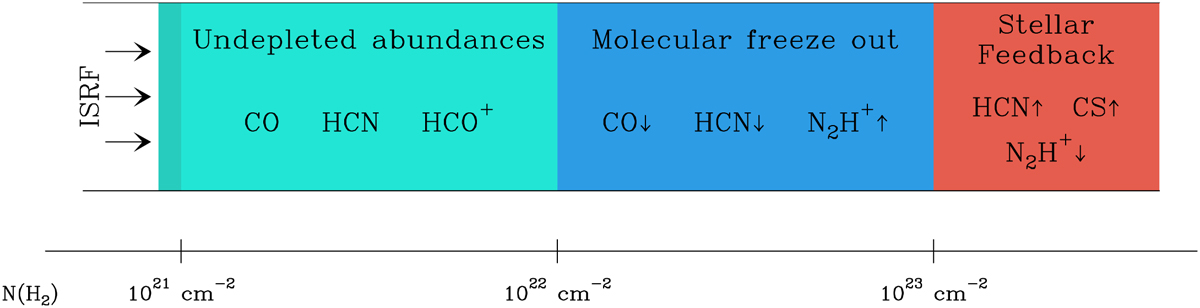
Cartoon view of the main chemical regimes identified in the observed clouds. The labels refer to representative species observed in each regime, and the arrows indicate their abundance trends. The numerical values on the horizontal scale represent approximate estimates of the column density at which the transition between the regimes occurs. This plot is inspired by Fig. 12 of Bergin & Tafalla (2007).
Current usage metrics show cumulative count of Article Views (full-text article views including HTML views, PDF and ePub downloads, according to the available data) and Abstracts Views on Vision4Press platform.
Data correspond to usage on the plateform after 2015. The current usage metrics is available 48-96 hours after online publication and is updated daily on week days.
Initial download of the metrics may take a while.