Fig. 5
Download original image
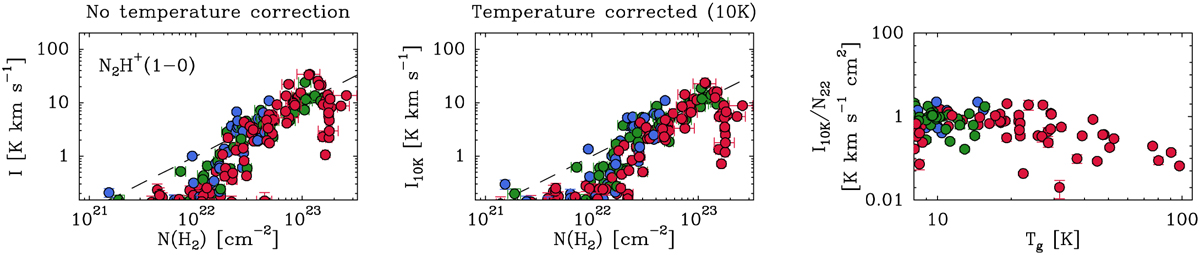
Distributions of N2H+(1−0) integrated intensity. Left panel: original uncorrected data. Middle panel: data after applying the correction factors described in Appendix D.2 to simulate emission at a constant temperature of 10 K. Right panel: ratio between the temperature-corrected intensity and the H2 column density (in units of 1022 cm−2) as a function of gas temperature. All data are color-coded as in previous figures.
Current usage metrics show cumulative count of Article Views (full-text article views including HTML views, PDF and ePub downloads, according to the available data) and Abstracts Views on Vision4Press platform.
Data correspond to usage on the plateform after 2015. The current usage metrics is available 48-96 hours after online publication and is updated daily on week days.
Initial download of the metrics may take a while.