Fig. 2
Download original image
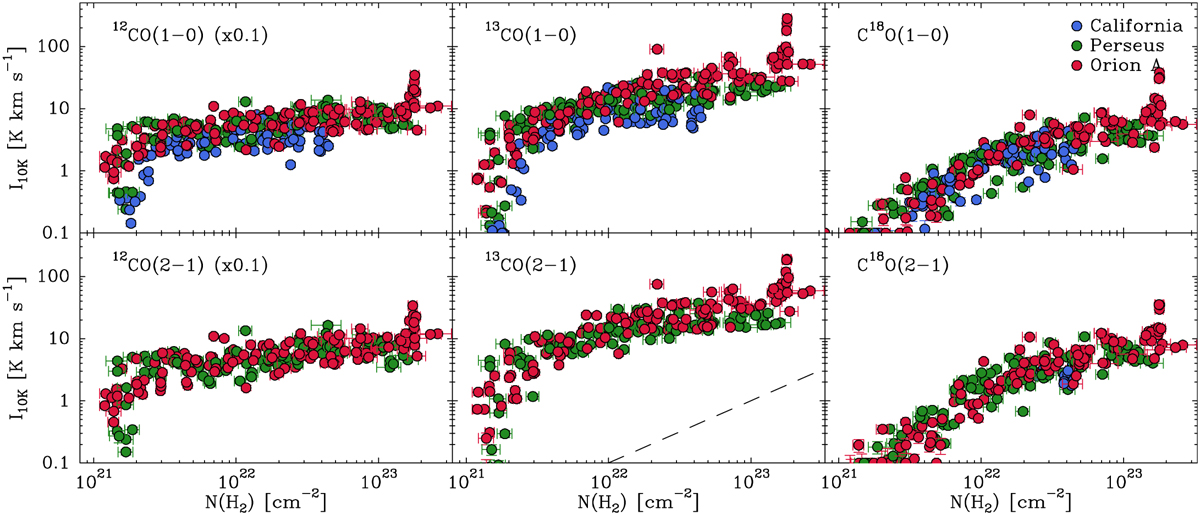
Temperature-corrected intensities of the J = 1−0 (top) and J = 2−1 (bottom) lines of the main CO isotopologs as a function of H2 column density in California, Perseus, and Orion A (blue, green, and red circles, respectively). Note the lower level of scatter and the better inter-cloud agreement compared to the uncorrected intensities shown in Fig. 1. The dashed line in the 13CO(2−1) panel indicates the slope of a linear trend.
Current usage metrics show cumulative count of Article Views (full-text article views including HTML views, PDF and ePub downloads, according to the available data) and Abstracts Views on Vision4Press platform.
Data correspond to usage on the plateform after 2015. The current usage metrics is available 48-96 hours after online publication and is updated daily on week days.
Initial download of the metrics may take a while.