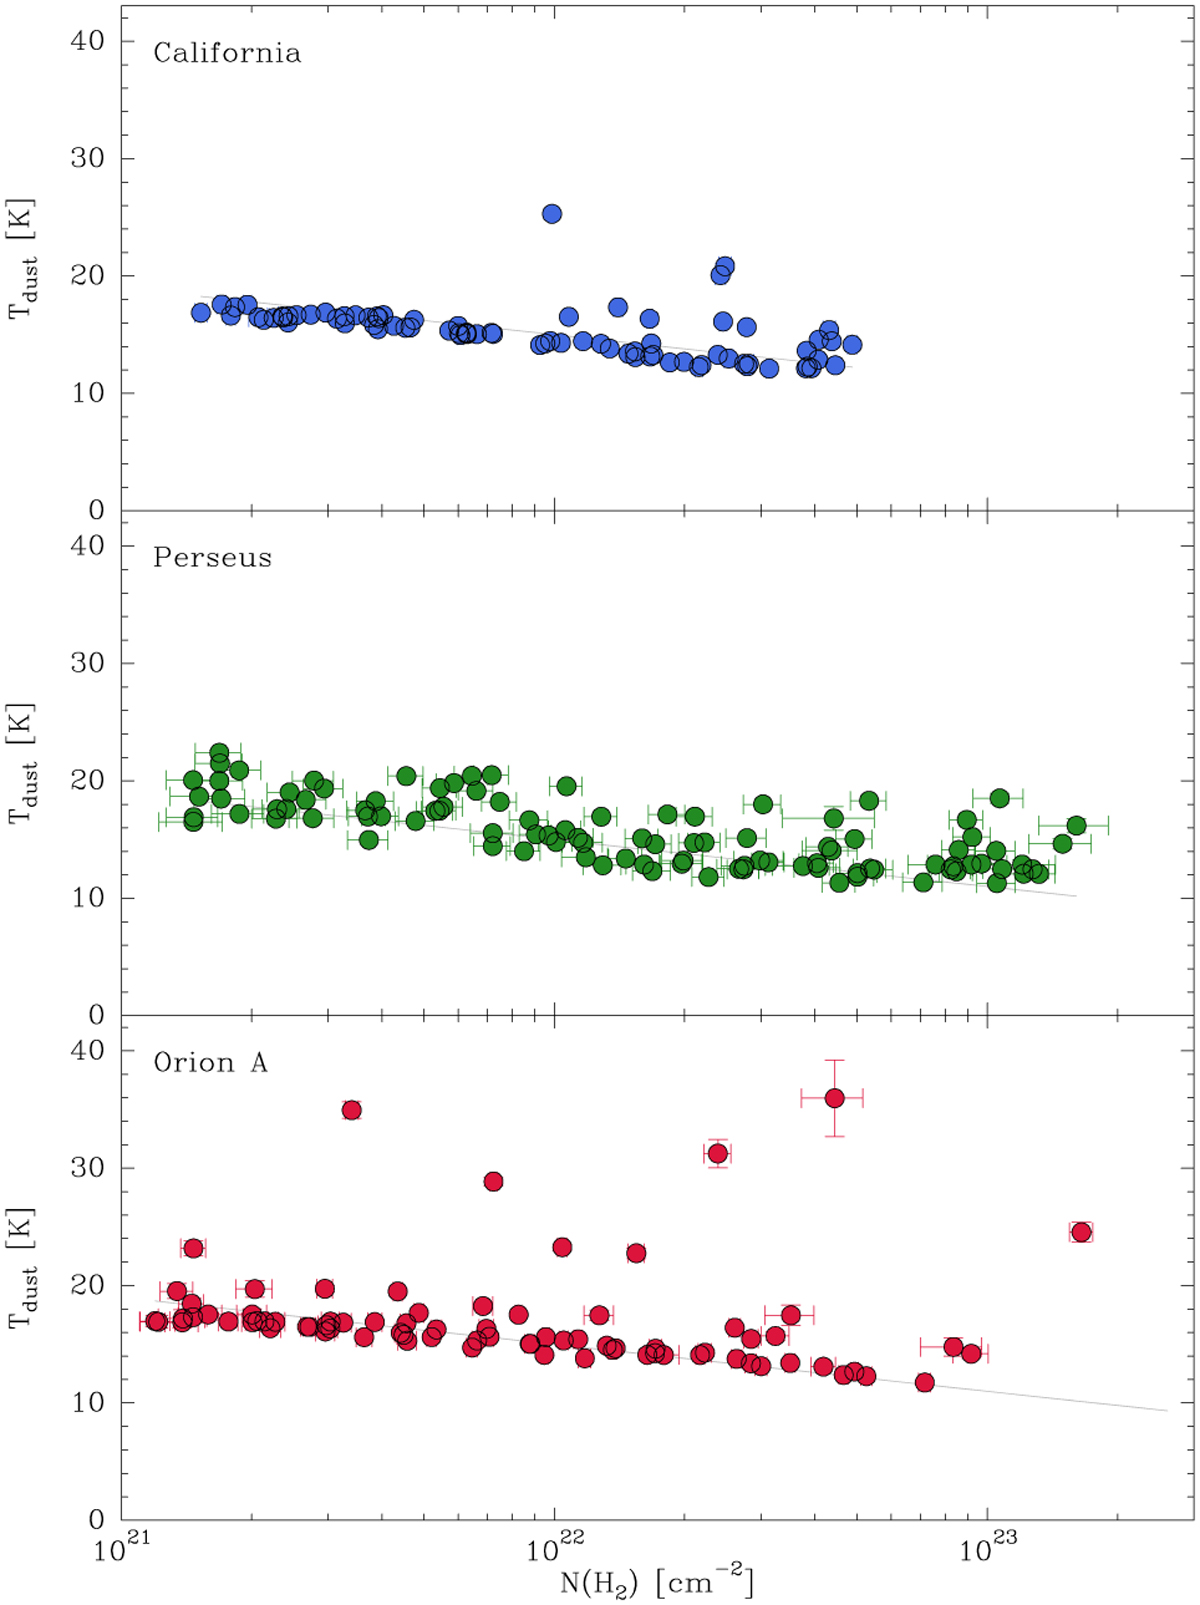
Fig. D.2
Download original image
Distribution of dust temperature as a function of H2 column density for the sampled positions of California, Perseus, and the regions of Orion A for which no NH3-based gas temperature is available. The gray line represents the simple analytic fit to the equilibrium dust temperature described in the text. Dust temperature data are from Lada et al. (2017, California), Zari et al. (2016, Perseus), an Lombardi et. al. (2014, Orion A).
Current usage metrics show cumulative count of Article Views (full-text article views including HTML views, PDF and ePub downloads, according to the available data) and Abstracts Views on Vision4Press platform.
Data correspond to usage on the plateform after 2015. The current usage metrics is available 48-96 hours after online publication and is updated daily on week days.
Initial download of the metrics may take a while.