Fig. 1
Download original image
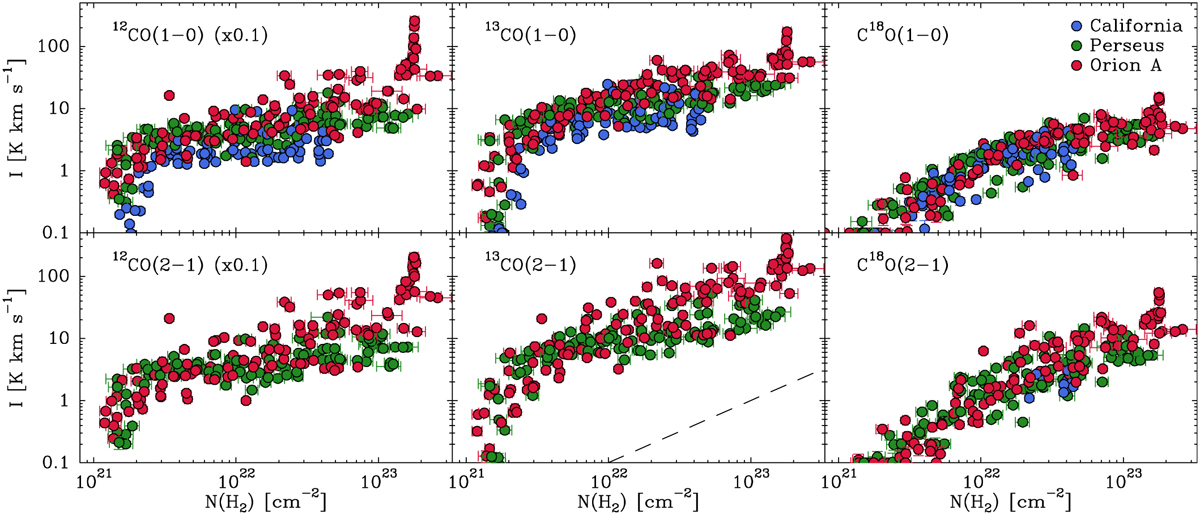
Velocity-integrated intensities of the J = 1−0 (top) and J = 2−1 (bottom) lines of the main CO isotopologs as a function of H2 column density. The data are color-coded by cloud: blue circles for California, green for Perseus, and red for Orion A. The dashed line in the 13CO(2−1) panel indicates the slope of a linear trend. No J = 2−1 data were taken for the California cloud apart from 13 C18O spectra from high column density positions. The lowest value of the intensity scale (0.1 K km s−1) approximately corresponds to the line detection limit.
Current usage metrics show cumulative count of Article Views (full-text article views including HTML views, PDF and ePub downloads, according to the available data) and Abstracts Views on Vision4Press platform.
Data correspond to usage on the plateform after 2015. The current usage metrics is available 48-96 hours after online publication and is updated daily on week days.
Initial download of the metrics may take a while.