Fig. 16.
Download original image
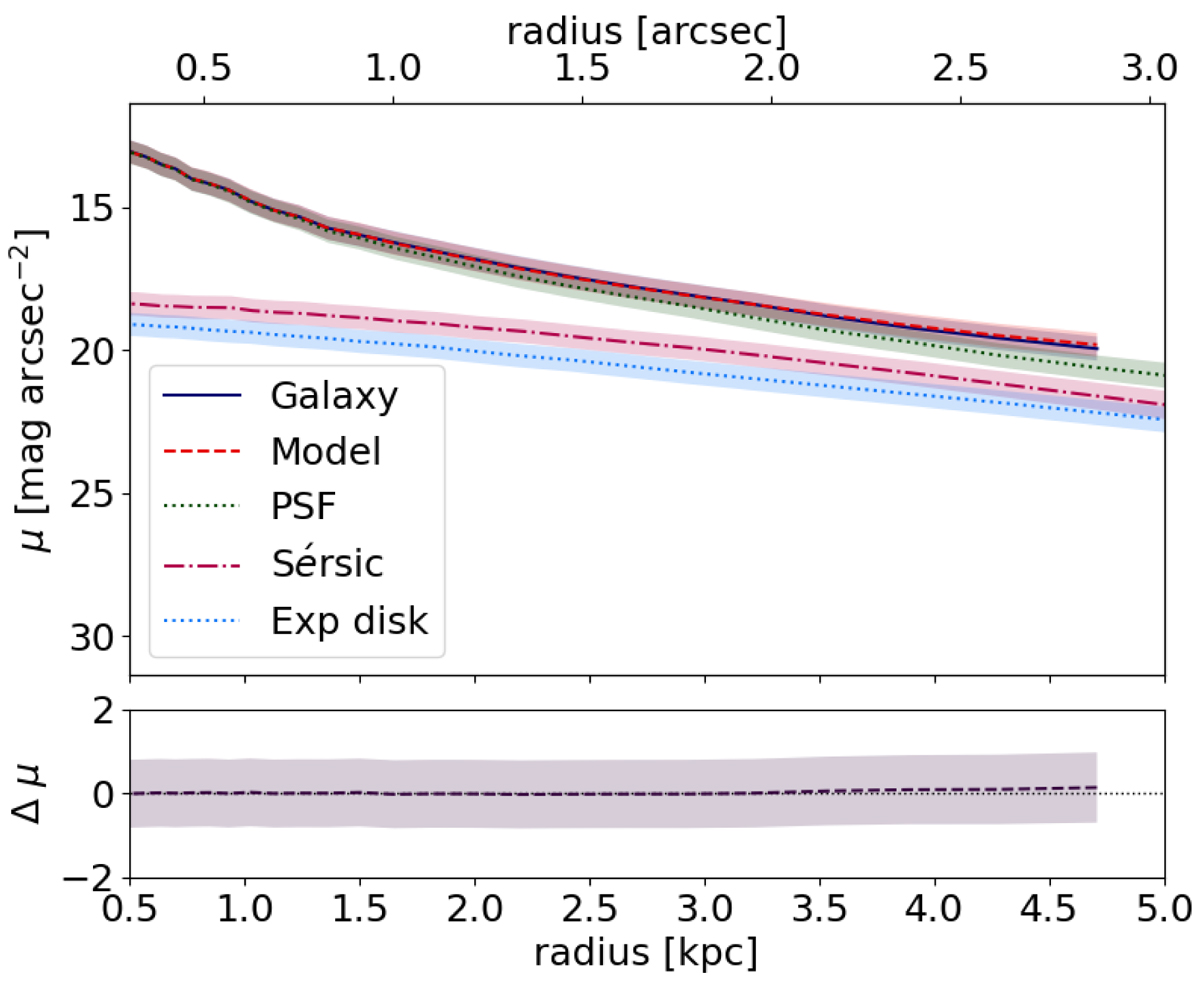
Radial surface brightness profile plot of J1628−0304. The blue line represents the galaxy component, the dashed red line shows the model, the dotted green line marks the PSF, the dashed pink line shows the Sérsic component, and the final component, the exponential disk component, is shown with the dotted light blue line. The error of each component is shown by the shaded area surrounding each curve.
Current usage metrics show cumulative count of Article Views (full-text article views including HTML views, PDF and ePub downloads, according to the available data) and Abstracts Views on Vision4Press platform.
Data correspond to usage on the plateform after 2015. The current usage metrics is available 48-96 hours after online publication and is updated daily on week days.
Initial download of the metrics may take a while.