Fig. 6
Download original image
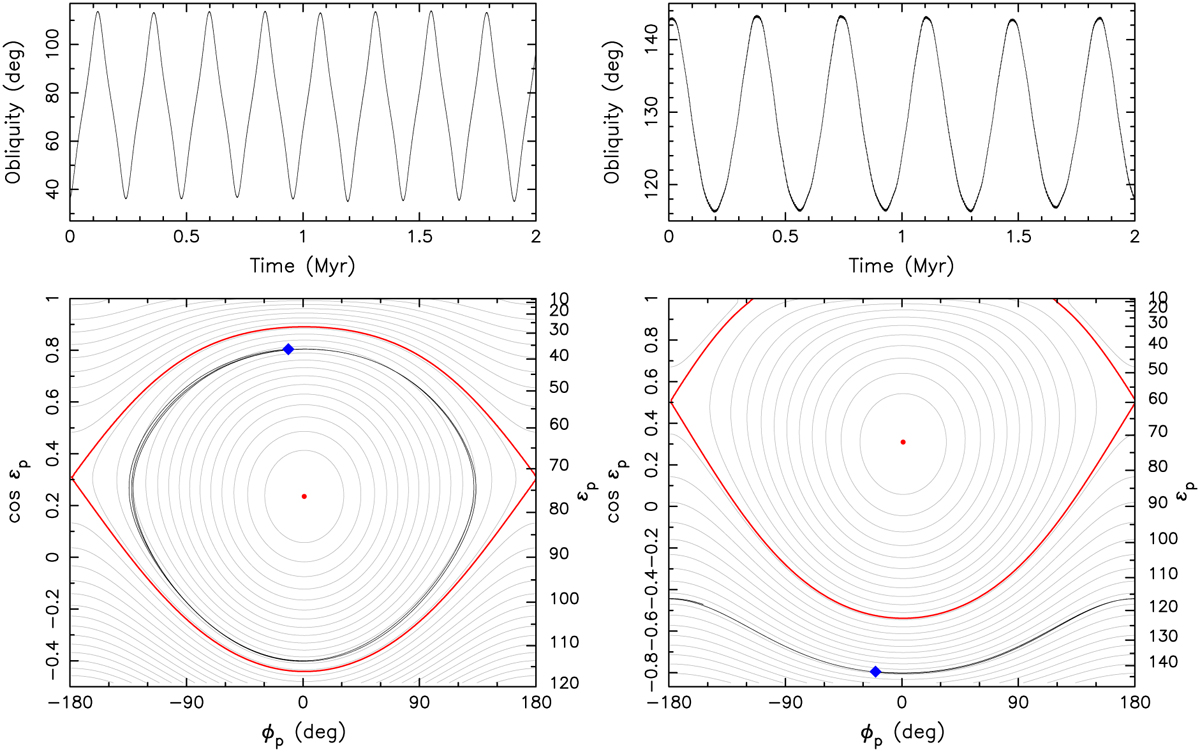
Results from a short-term integration of the rotational pole direction s for the L5 Trojan (1867) Deiphobus (left panels) and for the L4 Trojan (15663) Periphas (right panels). The top panel shows the osculating obliquity as a function of time. The bottom panel provides a projection of the s evolution over the 2 Myr timespan onto the phase space defined by the proper-frame variables: (i) obliquity εp on the ordinate, and (ii) longitude ϕp at the abscissa. The numerically integrated evolution is shown by a black line with the initial conditions shown by the blue diamond. The gray lines are idealized flow-lines from the simple Colombo top model. Red line is the separatrix of the resonant zone, and red points are locations of the Cassini state 2 (the Cassini state 4 is at the junction of the two separatrix branches with ϕp = ±180°).
Current usage metrics show cumulative count of Article Views (full-text article views including HTML views, PDF and ePub downloads, according to the available data) and Abstracts Views on Vision4Press platform.
Data correspond to usage on the plateform after 2015. The current usage metrics is available 48-96 hours after online publication and is updated daily on week days.
Initial download of the metrics may take a while.