Fig. 2
Download original image
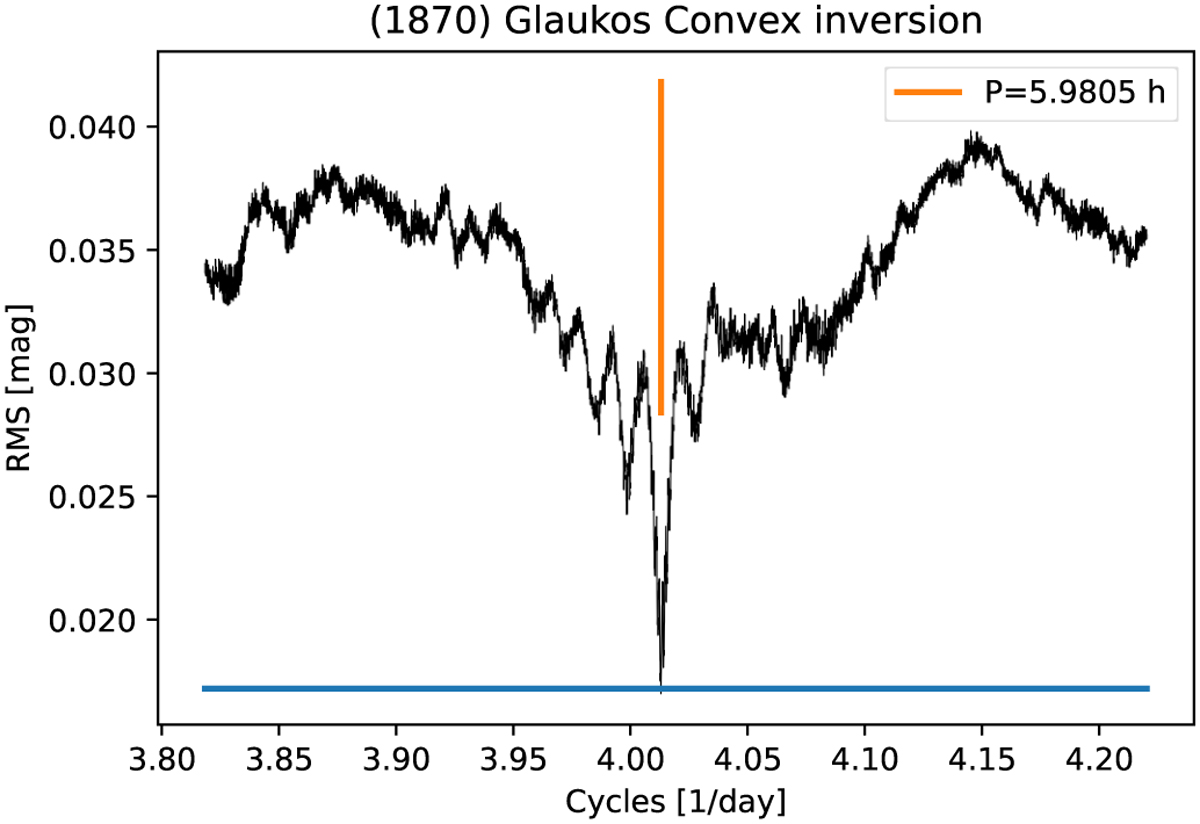
Periodogram in the rotation frequency domain for L5 JT (1870) Glaukos. The black line connects the minima over the trial runs sampling all local RMS values at a fixed rotation period but walking through all other parameters of the model. The blue horizontal line indicates the RMS threshold as defined by Eq. (4), while the orange vertical line represents the best-fitting sidereal rotation period.
Current usage metrics show cumulative count of Article Views (full-text article views including HTML views, PDF and ePub downloads, according to the available data) and Abstracts Views on Vision4Press platform.
Data correspond to usage on the plateform after 2015. The current usage metrics is available 48-96 hours after online publication and is updated daily on week days.
Initial download of the metrics may take a while.