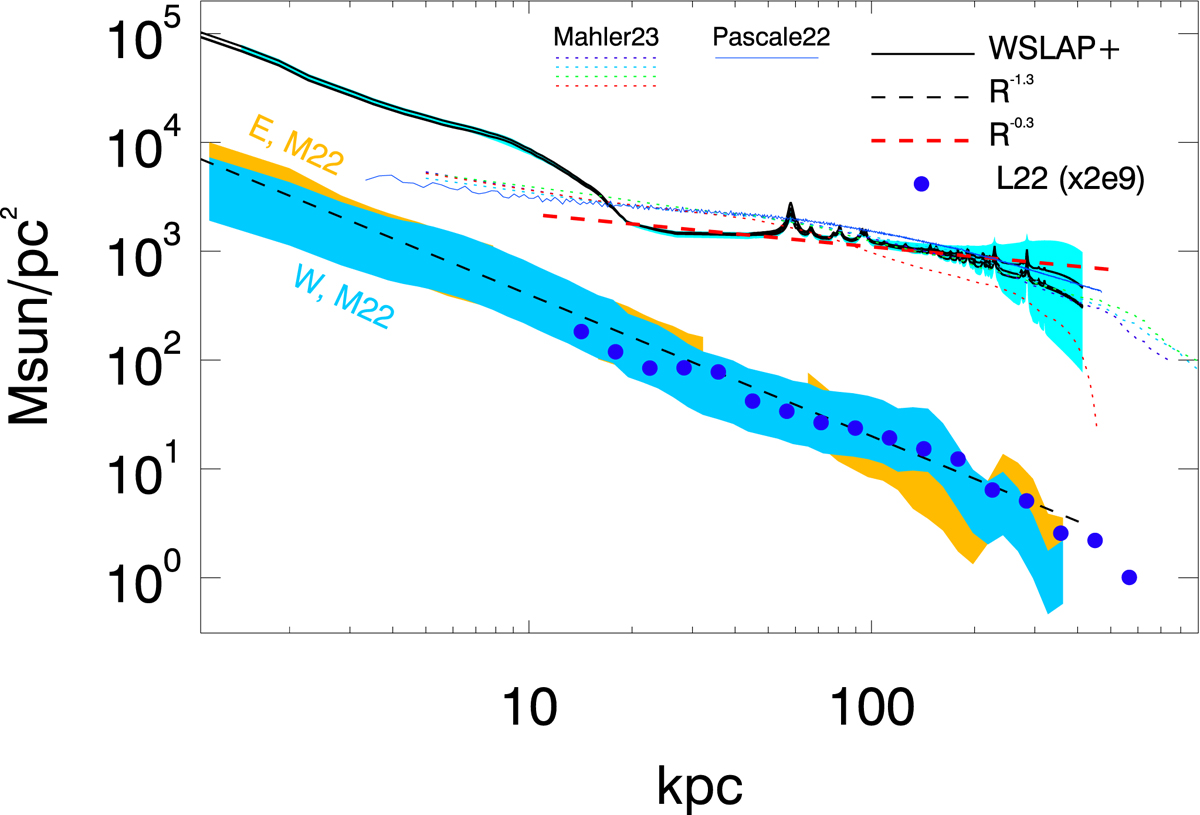
Fig. 8.
Download original image
Comparison of the total mass profile from the three lens models (solid lines) with the ICL profile from Montes & Trujillo (2022; shaded orange and blue regions for the east and west sectors, respectively) and the GC number profile from Lee et al. (2022; blue dots). For the latter, we re-scaled the number density by an arbitrary number of 2 × 10⁹ in order to overlap with the ICL profile. The black dashed line is a power law that scales with distance as R−1.3. The red dashed line is a power law that scales as R−0.3. The dotted lines are the density profiles from Mahler et al. (2023), while the blue solid line is the lens model from Pascale et al. (2022). These models are derived with similar lensing constraints but using different algorithms. The light-blue shaded region displays the range of models (minimum and maximum profiles) we obtained when we varied the initial condition of the optimization process.
Current usage metrics show cumulative count of Article Views (full-text article views including HTML views, PDF and ePub downloads, according to the available data) and Abstracts Views on Vision4Press platform.
Data correspond to usage on the plateform after 2015. The current usage metrics is available 48-96 hours after online publication and is updated daily on week days.
Initial download of the metrics may take a while.