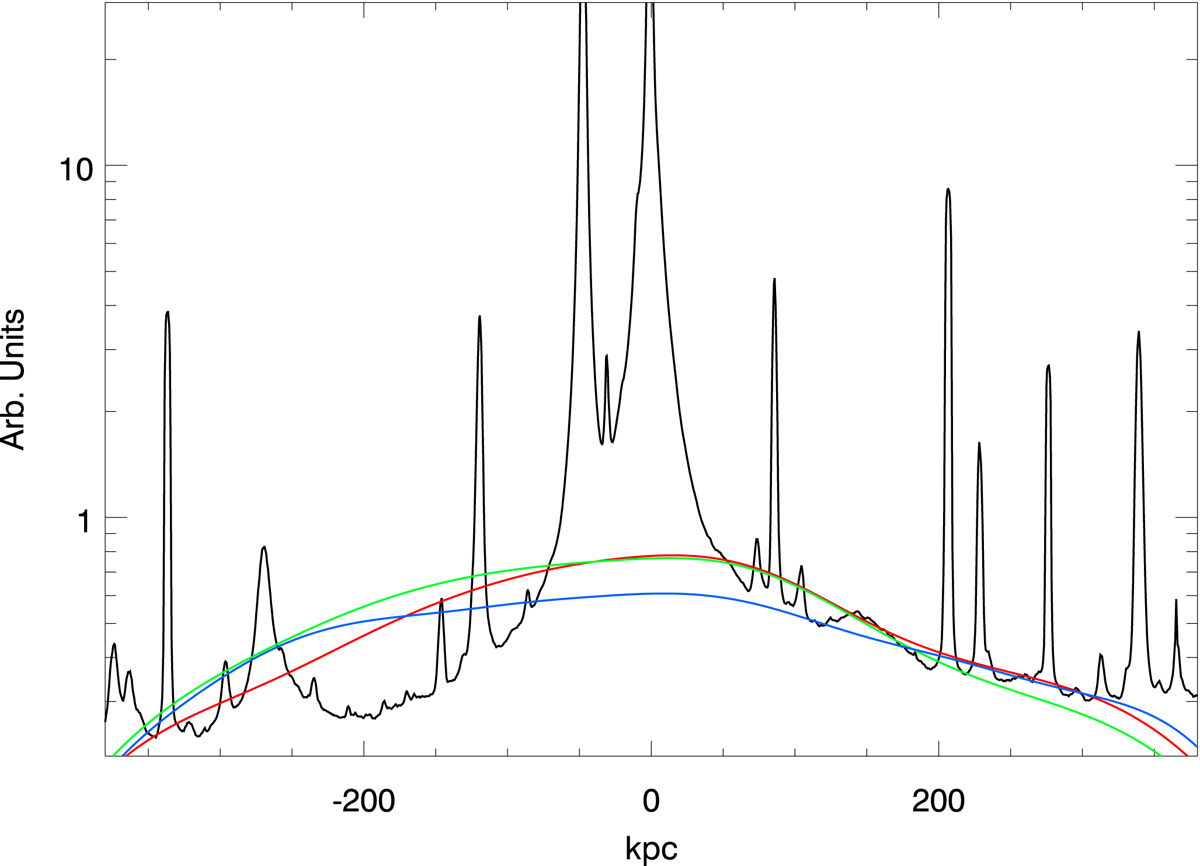
Fig. 6.
Download original image
1D scan of the light distribution versus DM. The x-axis is the distance to the BCG. The solid black line shows the mean of the light emission in the F277W band along the straight line shown in Fig. 5. The mean is computed over a box of 10 × 10 pixels at each position. The colored lines are the corresponding mean of the DM component for the three lens models discussed in this work. The red color is for the driver model, the green line is for model-2, or low-resolution (20 × 20 grid points) with 25 systems, and the blue model is for the high-resolution (25 × 25 grid points) model-3 with 25 systems. The DM profiles are re-scaled by arbitrary units to visually match the profile of the light emission. See Fig. 8 for a direct comparison of the profiles without the re-scaling.
Current usage metrics show cumulative count of Article Views (full-text article views including HTML views, PDF and ePub downloads, according to the available data) and Abstracts Views on Vision4Press platform.
Data correspond to usage on the plateform after 2015. The current usage metrics is available 48-96 hours after online publication and is updated daily on week days.
Initial download of the metrics may take a while.