Fig. 5.
Download original image
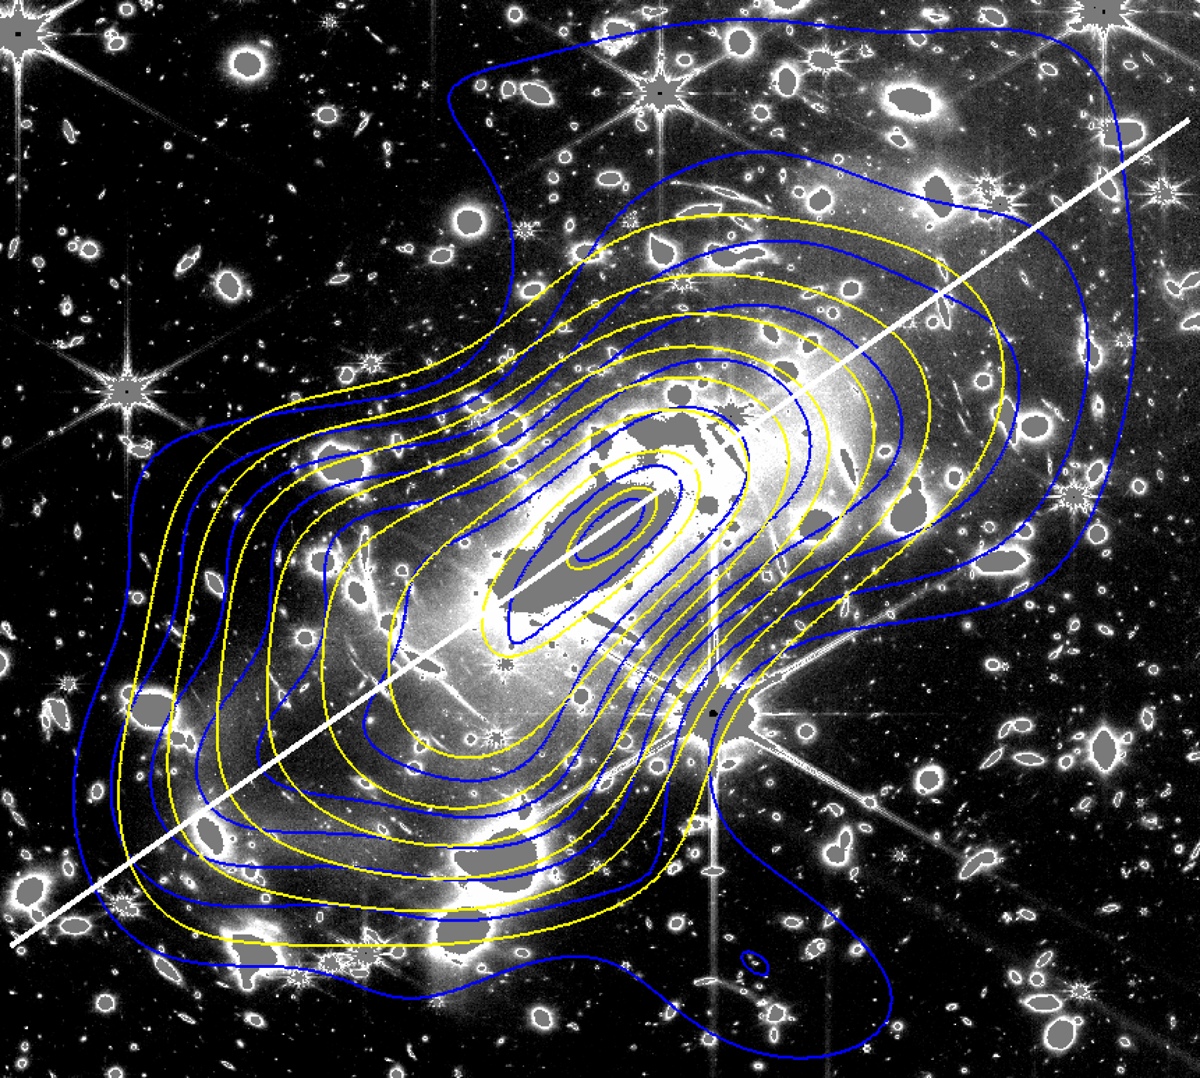
Projected total mass versus ICL. The contours represent the smooth component of the lens model obtained with the 25 constrained systems. The yellow contour is obtained with a regular grid of 20 × 20 cells while the blue contour is obtained with a higher resolution grid of 25 × 25 cells. The image is a masked version of the F277W band, where the ICL light can be better appreciated. The contours correspond to values of the convergence, κ, computed at a fiducial source redshift of zs = 3. Space between contours correspond to δκ = 0.1, with values starting at κ = 0.5. The last contour is for κ = 1.15. The white straight line marks the direction over which we constructed the 1D scan of the light profile and DM models.
Current usage metrics show cumulative count of Article Views (full-text article views including HTML views, PDF and ePub downloads, according to the available data) and Abstracts Views on Vision4Press platform.
Data correspond to usage on the plateform after 2015. The current usage metrics is available 48-96 hours after online publication and is updated daily on week days.
Initial download of the metrics may take a while.