Fig. 4.
Download original image
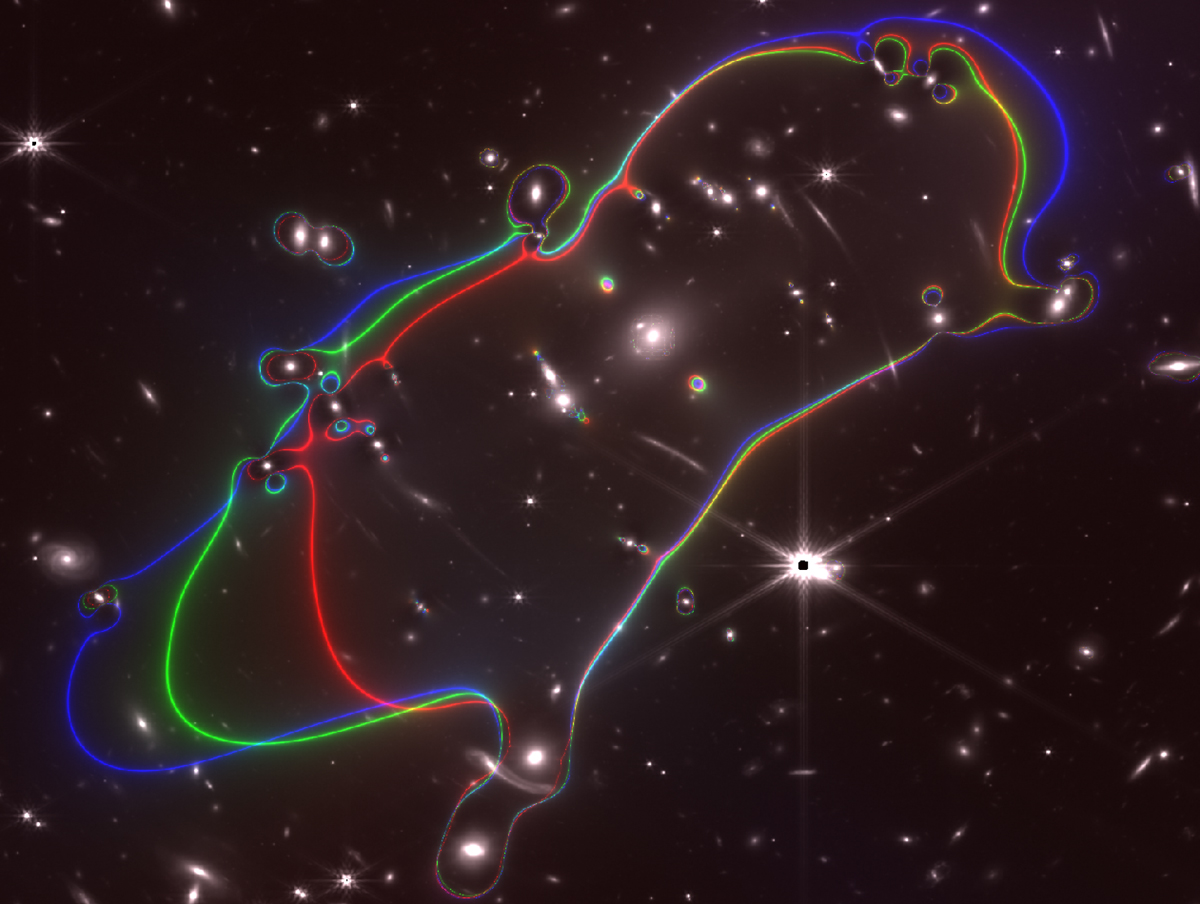
Critical curves of alternative lens models. All critical curves are computed at the redshift of system 7 (z = 5.1727). The red curve corresponds to the driver model derived with the six spectroscopic systems and a grid of 20 × 20 points. The green curve uses the same grid configuration but is derived from the 25 systems with constrained redshifts. The blue curve uses the same 25 systems but it is based on a higher resolution grid of 25 × 25 points.
Current usage metrics show cumulative count of Article Views (full-text article views including HTML views, PDF and ePub downloads, according to the available data) and Abstracts Views on Vision4Press platform.
Data correspond to usage on the plateform after 2015. The current usage metrics is available 48-96 hours after online publication and is updated daily on week days.
Initial download of the metrics may take a while.