Fig. 6
Download original image
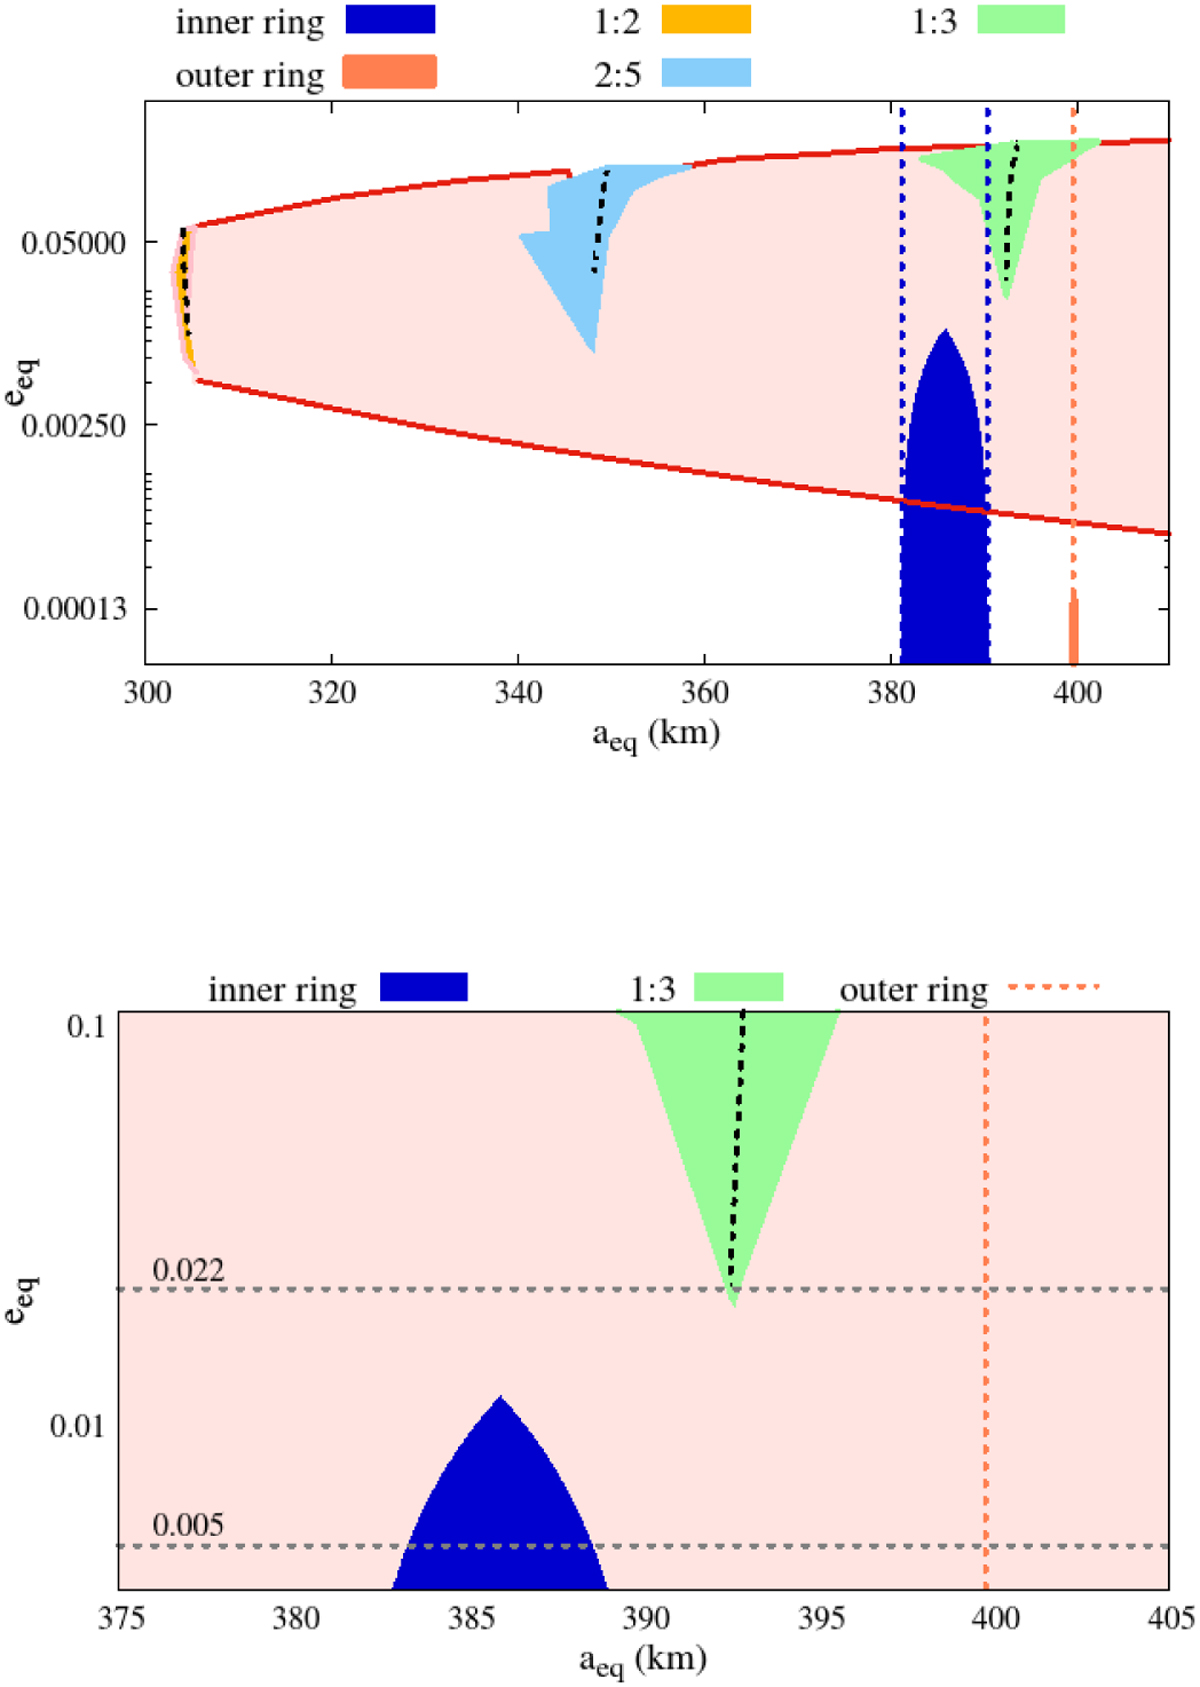
Map of the stable region around Chariklo in aeq vs eeq space shown on the top plot. The stable region indicated by the pink colour is due to the first kind orbits. This region is limited by two red lines. The bottom line corresponds to the semi-major axis and eccentricity of the first kind periodic orbits, and the top line refers to quasi-periodic orbits. The yellow, blue, and green regions are related to 1:2, 2:5, and 1:3 resonances, respectively. The black dashed lines indicate the centres of each resonance, determined through the geometry of the resonant orbits. The dark blue and coral regions show the ranges (aeq, eeq) that correspond to the locations of the inner (C1R) and outer (C2R) rings of Chariklo, respectively. The dashed dark blue and coral lines show the edges of the rings. A zoom-in on the bottom plot shows two horizontal lines which indicate the limits of the eccentricities given by M21.
Current usage metrics show cumulative count of Article Views (full-text article views including HTML views, PDF and ePub downloads, according to the available data) and Abstracts Views on Vision4Press platform.
Data correspond to usage on the plateform after 2015. The current usage metrics is available 48-96 hours after online publication and is updated daily on week days.
Initial download of the metrics may take a while.