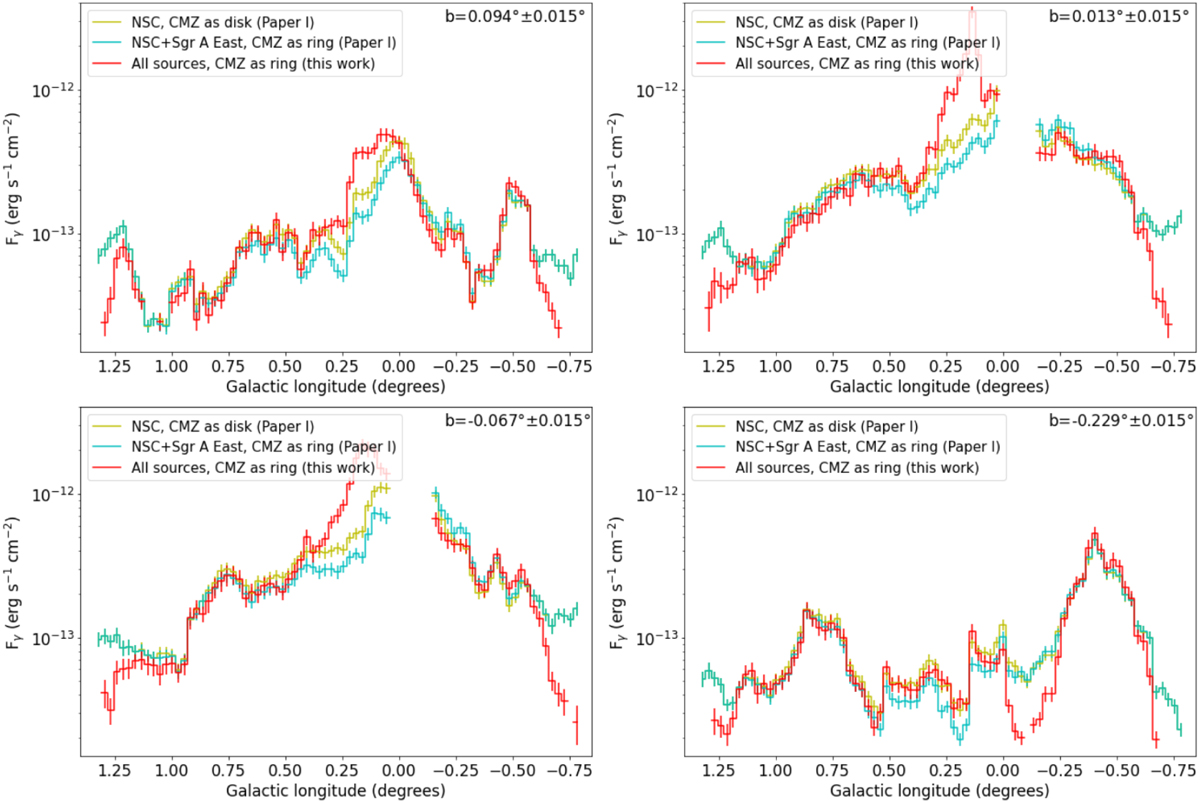
Fig. 6
Download original image
Surface gamma-ray flux profiles for successful models. Profiles are obtained between 0.797° < l < 1.337° and b = 0.094° (top-left panel), 0.013° (top-right panel), −0.067° (bottom-left panel) and −0.229° (bottom-right panel). The profile is binned adopting the CTA angular resolution, 0.03°. Lines show gamma-ray flux considering 50h of observation with CTA and Eγ ≥ 1 TeV. Yellow and cyan profiles represent the models proposed in Paper I with the CMZ as a disk and a ring. The red profiles are from the model considering differential diffusion, polar advection, and CR injection from NSC, Sgr A East, AC, and QC (all sources). The central 0.2° around Sgr A* was excluded.
Current usage metrics show cumulative count of Article Views (full-text article views including HTML views, PDF and ePub downloads, according to the available data) and Abstracts Views on Vision4Press platform.
Data correspond to usage on the plateform after 2015. The current usage metrics is available 48-96 hours after online publication and is updated daily on week days.
Initial download of the metrics may take a while.