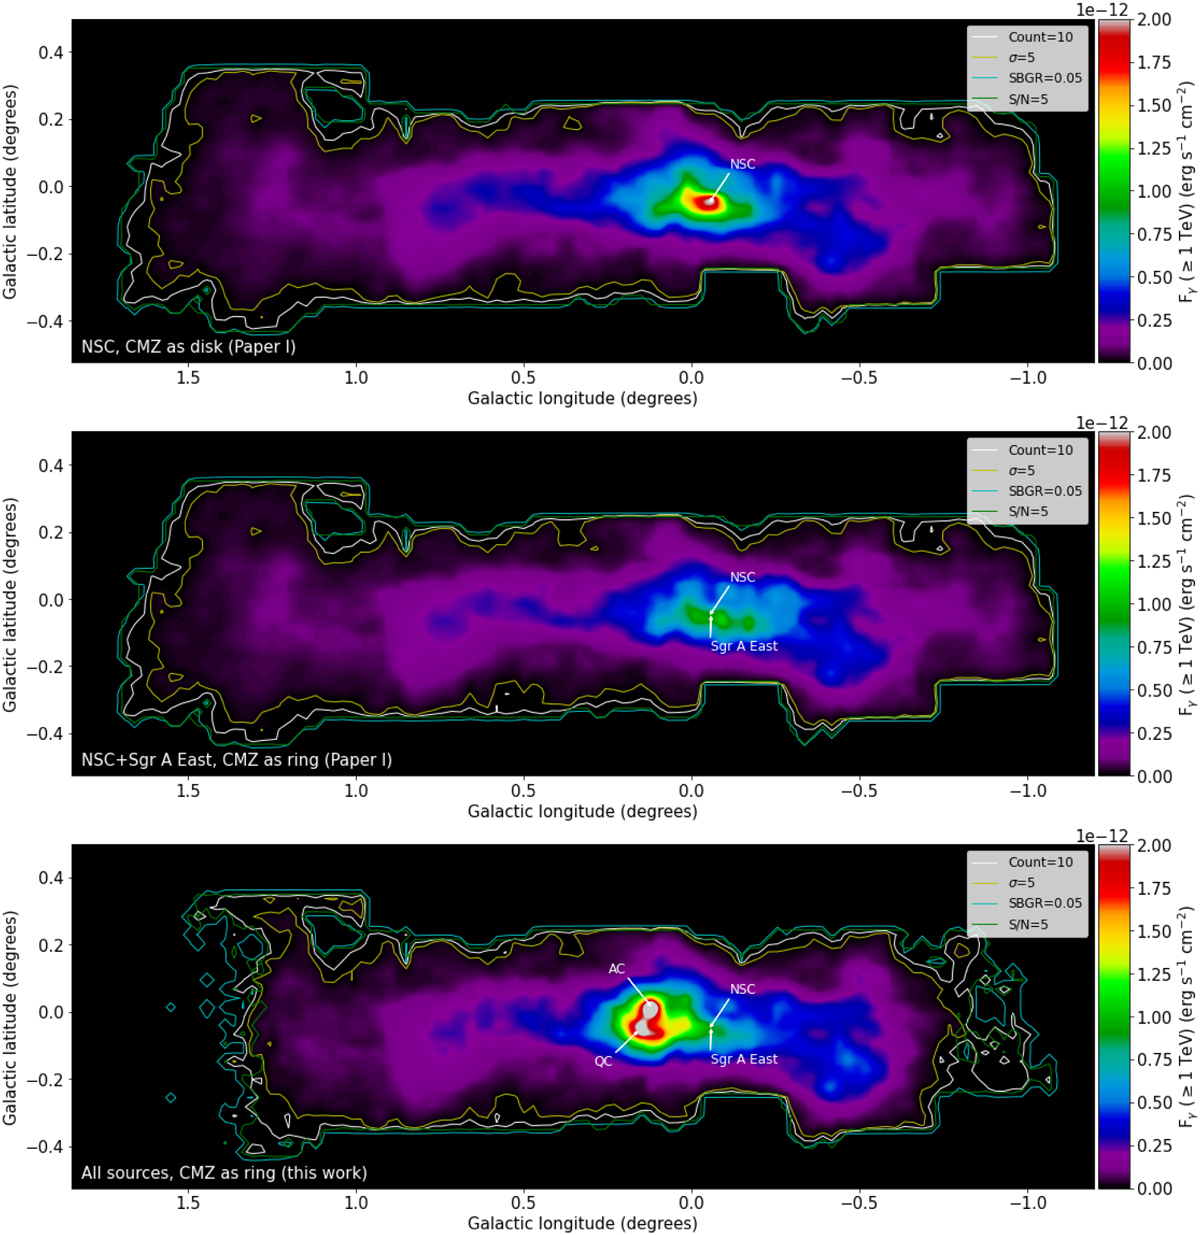
Fig. 5
Download original image
Synthetic maps of gamma-ray flux, considering 50 h of observation with CTA and Eγ ≥ 1 TeV. Top and middle panels: gamma-ray flux of CMZ models without differential diffusion and polar advection, reported in Paper I. Bottom panel: gamma-ray flux of CMZ model with differential diffusion and polar advection. CR sources and the CMZ morphology are indicated on each panel. White, yellow, cyan and green contours are lower limits to Nγ, σ, SBGR and S/N, respectively. All maps have been smoothed with a 0.03° Gaussian function to adopt the CTA beamwidth.
Current usage metrics show cumulative count of Article Views (full-text article views including HTML views, PDF and ePub downloads, according to the available data) and Abstracts Views on Vision4Press platform.
Data correspond to usage on the plateform after 2015. The current usage metrics is available 48-96 hours after online publication and is updated daily on week days.
Initial download of the metrics may take a while.