Fig. 4
Download original image
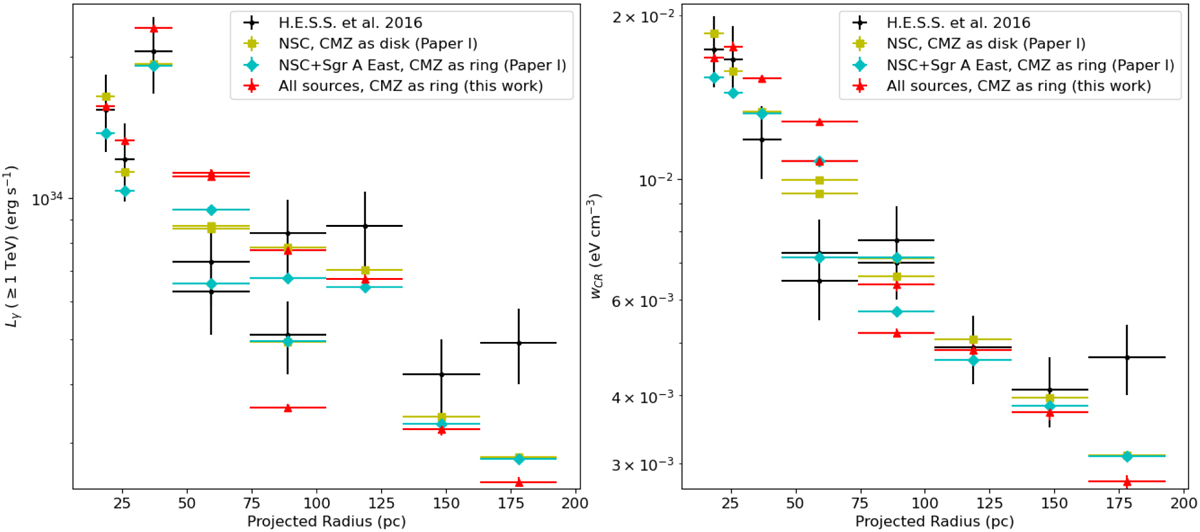
Gamma-ray luminosity and average CR energy density for our satisfactory models. Left panel: gamma-ray luminosity profiles from Sgr A* along the Galactic disk, taken from Fig. 3 and from Paper I. Right panel: corresponding average CR energy densities. Black crosses denote the observed gamma-ray luminosity (left panel) and the indirect observations of CRs (right panel) computed by H.E.S.S. Collaboration (2016). Yellow squares and cyan diamonds correspond to the CMZ ring and disk models without differential diffusion and polar advection developed in Paper I. On the disk model, the only CR source is the NSC, while on the ring model the CR sources are the NSC and Sgr A East. Red triangles correspond to the new model with the CMZ as a ring, considering differential diffusion, polar advection, and CR injection from all sources (NSC, Sgr A East, AC and QC).
Current usage metrics show cumulative count of Article Views (full-text article views including HTML views, PDF and ePub downloads, according to the available data) and Abstracts Views on Vision4Press platform.
Data correspond to usage on the plateform after 2015. The current usage metrics is available 48-96 hours after online publication and is updated daily on week days.
Initial download of the metrics may take a while.