Fig. 3
Download original image
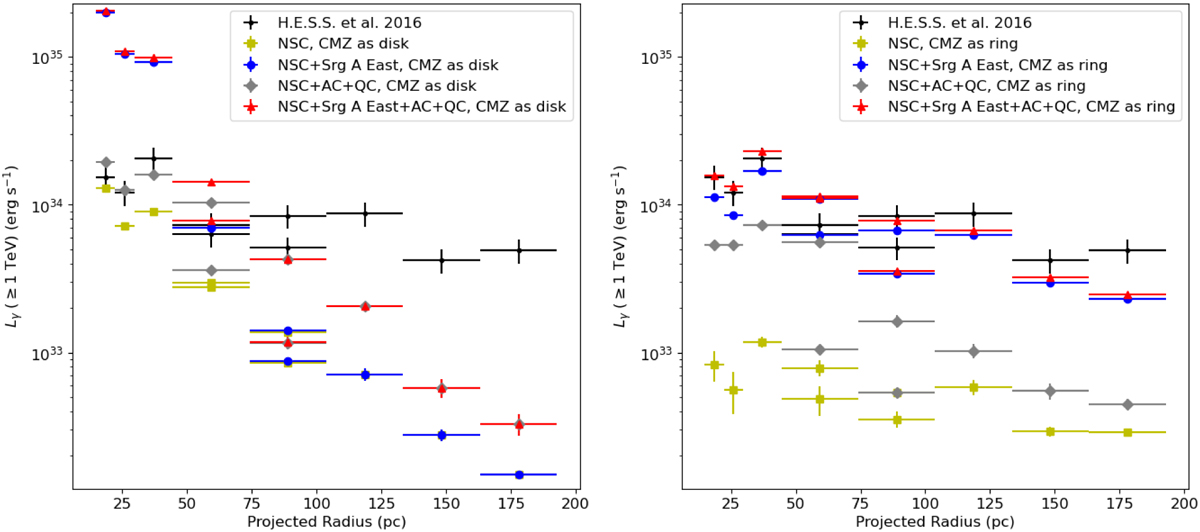
CMZ gamma-ray luminosity profiles, computed using the model with realistic CR dynamics introduced in this paper. The luminosities are calculated by integrating the flux in the regions shown in the bottom right panel of Fig. 2. Left panel: gamma-ray profiles considering the CMZ as a disk, for all models shown in the left panels of Fig. 2. Right panel: gamma-ray profiles considering the CMZ as a ring, for the models shown in the top four right panels of Fig. 2. Black crosses denote the observed gamma-ray luminosity computed by H.E.S.S. Collaboration (2016) in the CMZ. Yellow squares, blue circles, gray diamonds and red triangles, represent the gamma-ray luminosity considering the NSC, NSC+Sgr A East, NSC+AC+QC, and NSC+Sgr A East+AC+QC, as CR sources, respectively.
Current usage metrics show cumulative count of Article Views (full-text article views including HTML views, PDF and ePub downloads, according to the available data) and Abstracts Views on Vision4Press platform.
Data correspond to usage on the plateform after 2015. The current usage metrics is available 48-96 hours after online publication and is updated daily on week days.
Initial download of the metrics may take a while.