Fig. 2
Download original image
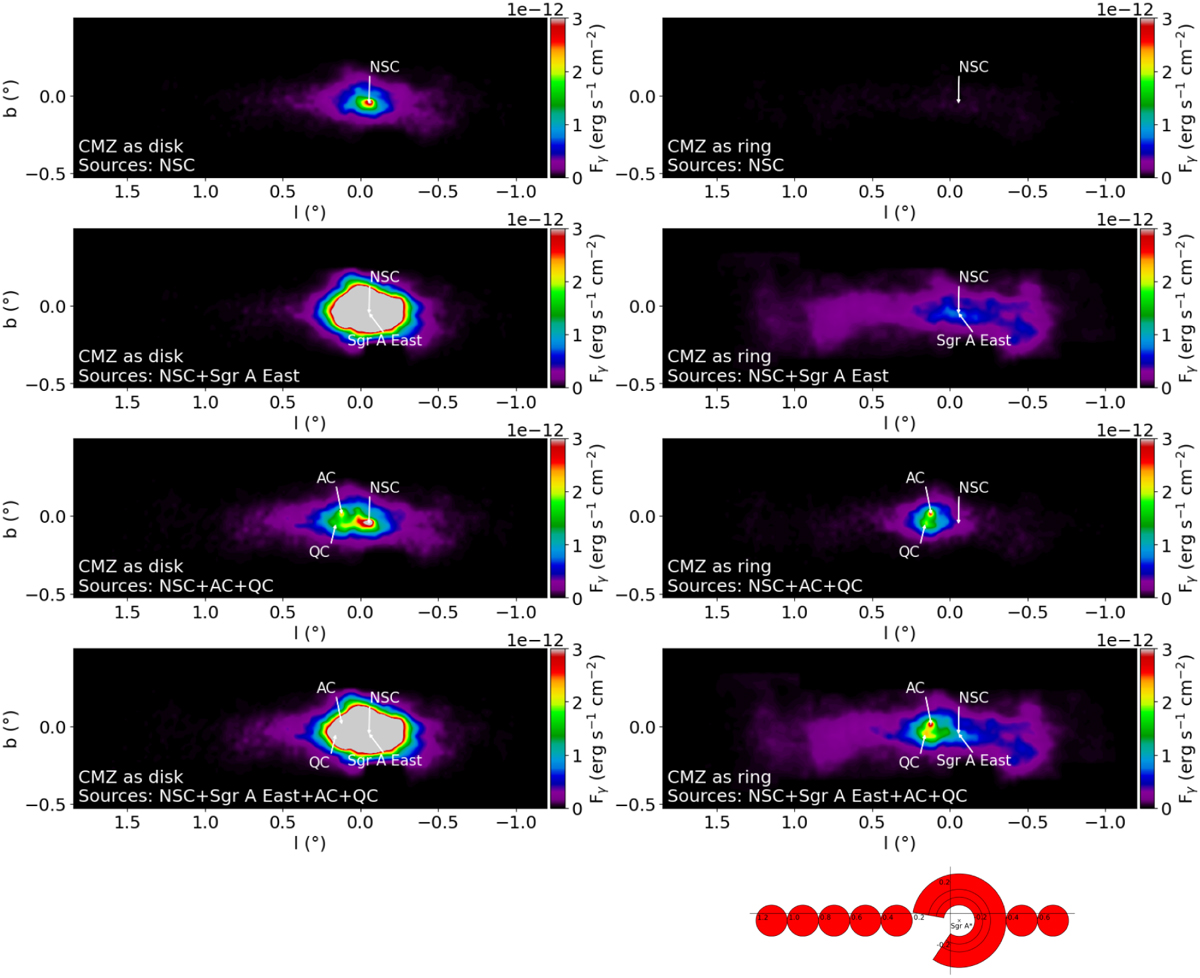
Gamma-ray synthetic maps computed as observed from the Earth. Left panels: synthetic maps for the CMZ as a disk and different CR sources (indicated on each panel). Top four right panels: synthetic maps for the CMZ as a ring and different CR sources (indicated on each panel). All maps have been smoothed with a 0.03° Gaussian function to adopt the best CTA beamwidth. Bottom right panel: regions where we contrasted our models with the H.E.S.S. Collaboration (2016) results.
Current usage metrics show cumulative count of Article Views (full-text article views including HTML views, PDF and ePub downloads, according to the available data) and Abstracts Views on Vision4Press platform.
Data correspond to usage on the plateform after 2015. The current usage metrics is available 48-96 hours after online publication and is updated daily on week days.
Initial download of the metrics may take a while.