Fig. 1
Download original image
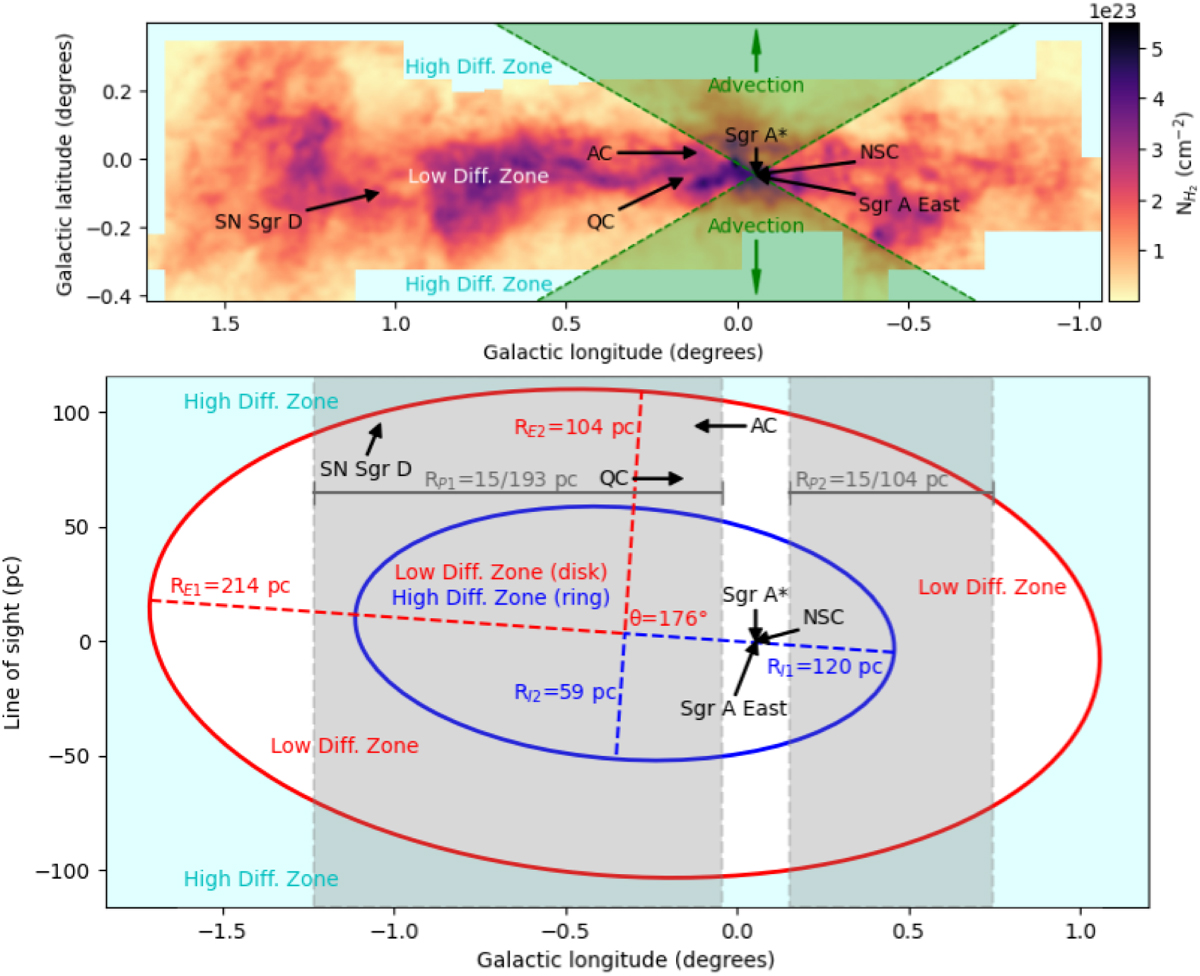
CMZ gas distribution in our model, schematic representation of CR dynamics, and CR source location. Top panel: CMZ particle column density spatial distribution computed from CO (J = 3–2). The CMZ was covered between −1.07° < l < 1.73° and −0.42° < b < 0.40°, within a velocity range |υ| < 220 km s−1 (Oka et al. 2012). The color scale represents the column number density of H2, and a low diffusion of CRs is considered within this region. The cyan outer area corresponds to regions where no gas column density was measured, for which a high diffusion of CRs is computed. The green area denotes the zone with polar advection. Bottom panel: CMZ line of sight distribution boundaries for both the disk and ring configurations, according to Paper I. The red ellipse is the external boundary for both scenarios, and the blue ellipse is the internal boundary for the ring scenario. A low diffusion of CRs is defined inside the red ellipse for the disk and between the red and blue ellipses for the ring. High diffusion of CRs is computed over the cyan outer area and inside the red ellipse for the ring scenario. RE1 and RE2 are the semi-major and semi-minor axis for the external ellipse, and RI1 and RI2 are the semi-major and semi-minor axis for the internal ellipse. Gray zones demarcate the area projected along the line of sight analyzed in the HESS work, where RP1 and RP2 are the limits for the projected radii from Sgr A*.
Current usage metrics show cumulative count of Article Views (full-text article views including HTML views, PDF and ePub downloads, according to the available data) and Abstracts Views on Vision4Press platform.
Data correspond to usage on the plateform after 2015. The current usage metrics is available 48-96 hours after online publication and is updated daily on week days.
Initial download of the metrics may take a while.