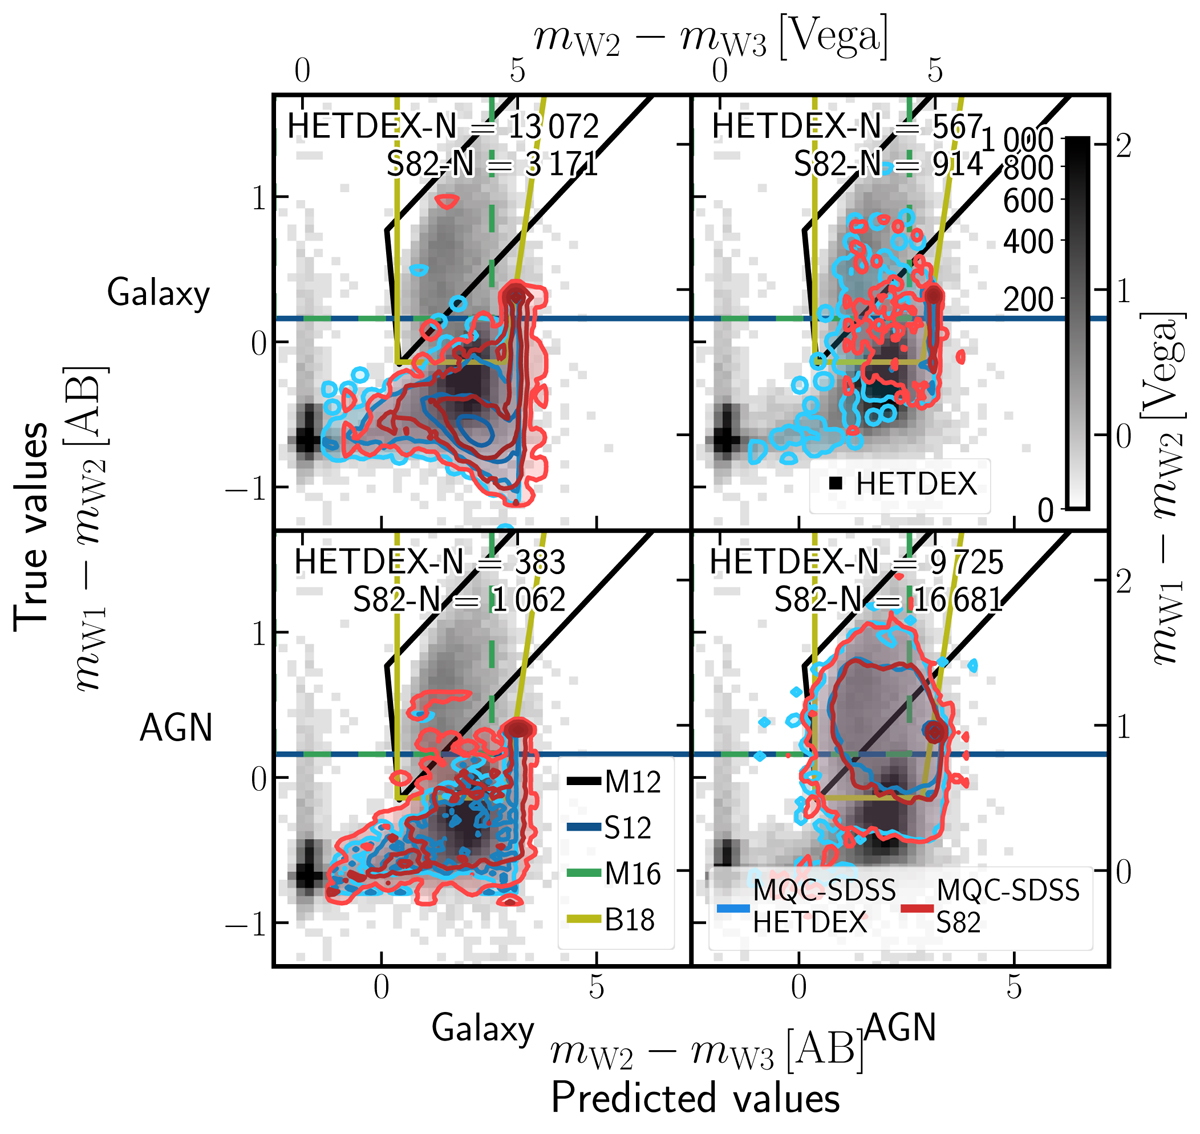
Fig. 9.
Download original image
W1–W2, W2–W3 colour-colour diagrams for sources in the testing subset, from HETDEX, and labelled sources from S82 given their position in the AGN-galaxy confusion matrix (see, for HETDEX, rightmost panel of Fig. 7). In the background, density plot of all CW-detected sources in the full HETDEX field sample is displayed. Colour of each square represents the number of sources in that position of parameter space, with darker squares having more sources (as defined in the colourbar of the upper-right panel). Contours represent distribution of sources for each of the aforementioned subsets at 1, 2, 3, and 4σ levels (shades of blue, for testing set and shades of red for labelled S82 sources). Coloured, solid lines display limits from the criteria for the detection of AGNs described in Sect. 5.1.1.
Current usage metrics show cumulative count of Article Views (full-text article views including HTML views, PDF and ePub downloads, according to the available data) and Abstracts Views on Vision4Press platform.
Data correspond to usage on the plateform after 2015. The current usage metrics is available 48-96 hours after online publication and is updated daily on week days.
Initial download of the metrics may take a while.