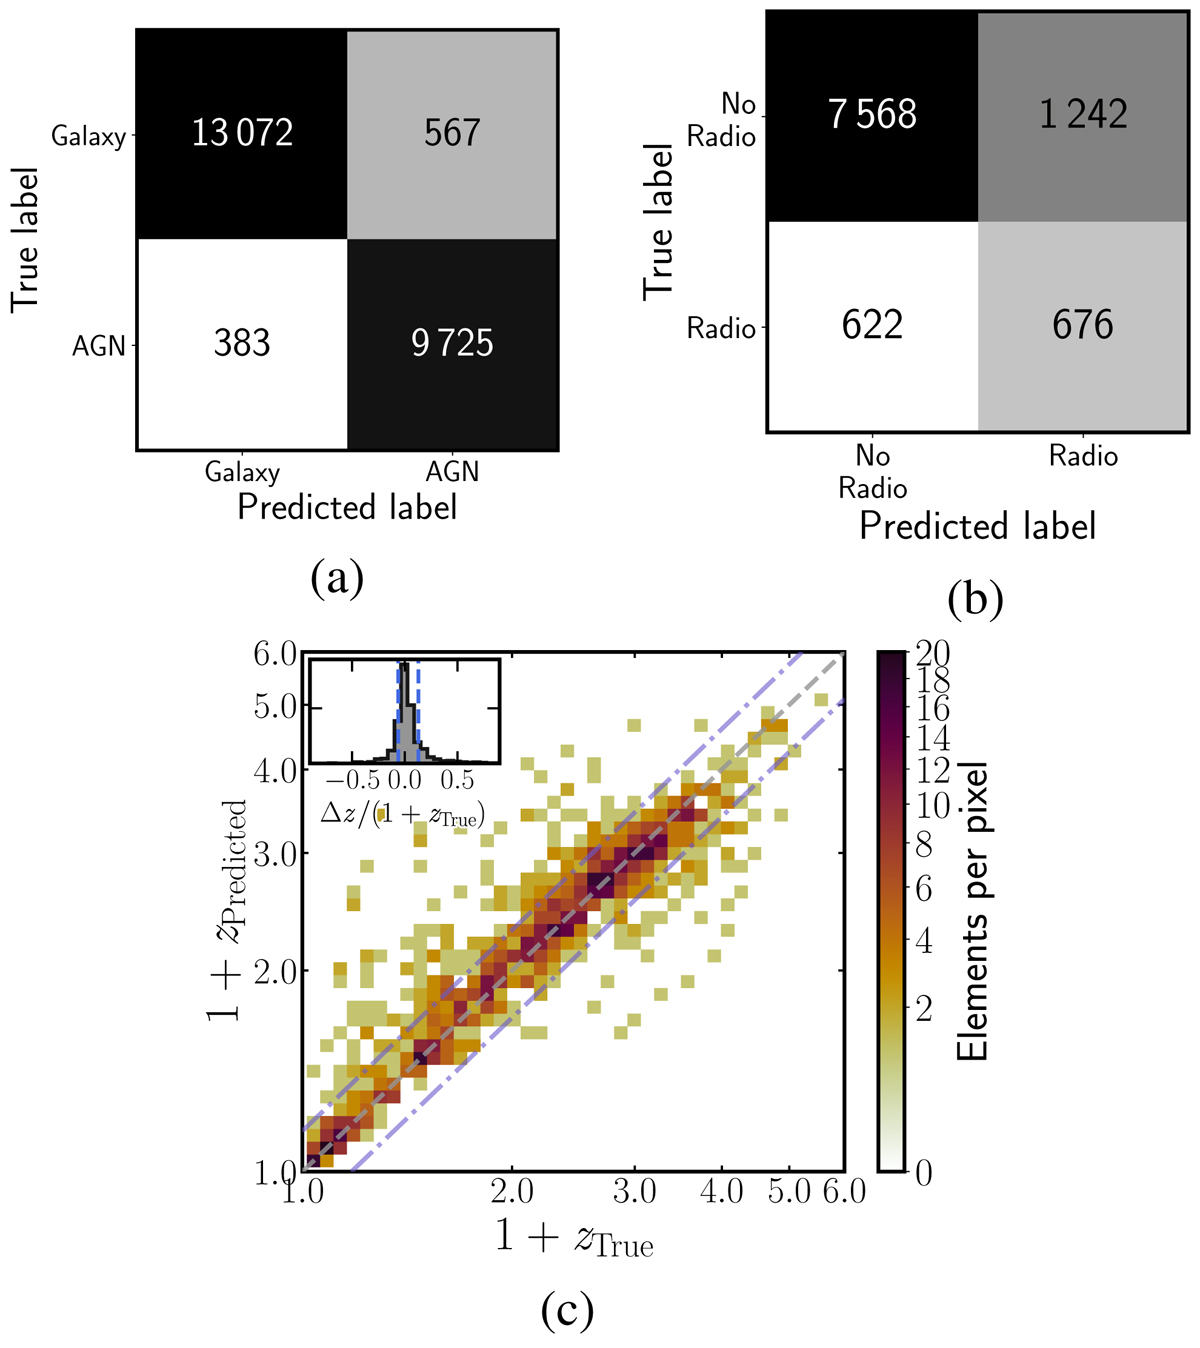
Fig. 6.
Download original image
Performance of individual models (AGN-galaxy classification, radio-detectability classification and redshift regression) when applied to the HETDEX test subset. (a) Confusion matrix for AGN-galaxy classification. (b) Same as (a), but for radio detection. (c) Density plot comparison between original and the predicted redshifts. Grey, dashed line shows the 1:1 relation while dot-dashed lines show the limits for outliers (cf. Eq. (18)). Inset displays the distribution of #x0394;zN with a < #x0394;zN > = 0.0442.
Current usage metrics show cumulative count of Article Views (full-text article views including HTML views, PDF and ePub downloads, according to the available data) and Abstracts Views on Vision4Press platform.
Data correspond to usage on the plateform after 2015. The current usage metrics is available 48-96 hours after online publication and is updated daily on week days.
Initial download of the metrics may take a while.