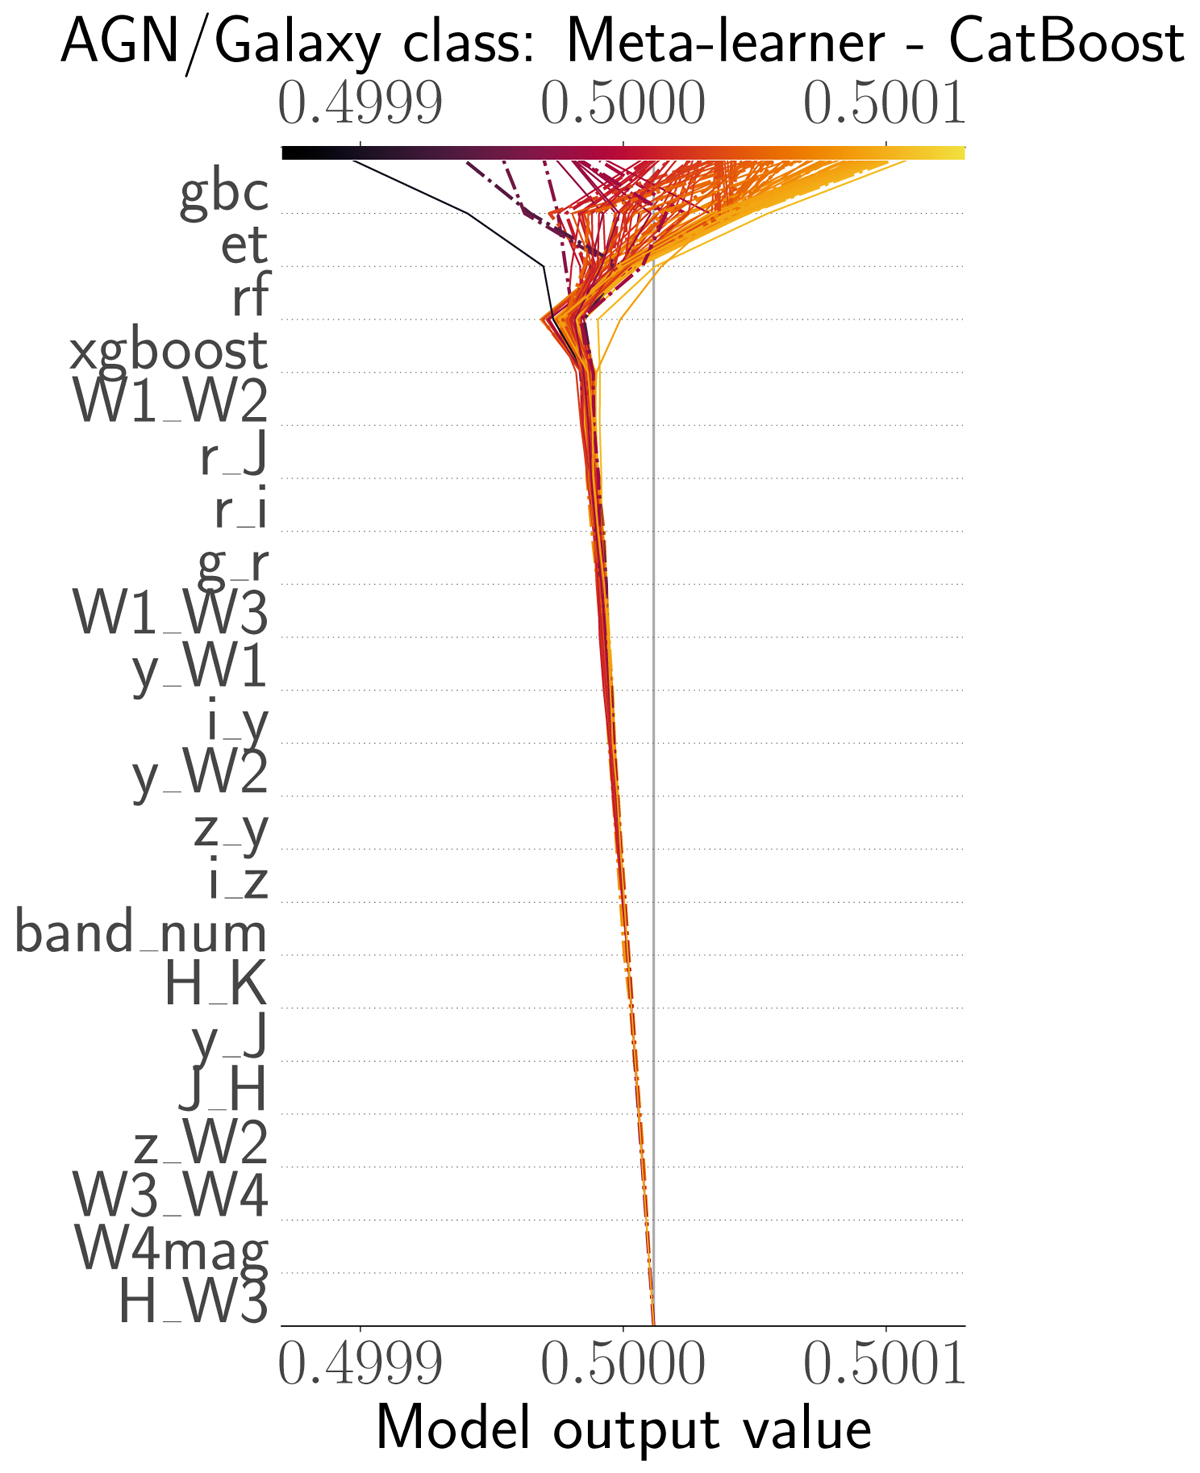
Fig. 13.
Download original image
Decision plot from SHAP values for AGN-galaxy classification from the 121 high redshift (z ≥ 4) spectroscopically confirmed AGNs in HETDEX. Horizontal axis represents the model’s output with a starting value for each source centred on the selected naive threshold for classification. Vertical axis shows features used in the model sorted, from top to bottom, by decreasing mean absolute SHAP value. Each prediction is represented by a coloured line corresponding to its final predicted value as shown by the colourbar at the top. Moving from the bottom of the plot to the top, SHAP values for each feature are added to the previous value in order to highlight how each feature contributes to the overall prediction. Predictions for sources detected by LOFAR are highlighted with a dotted, dashed line.
Current usage metrics show cumulative count of Article Views (full-text article views including HTML views, PDF and ePub downloads, according to the available data) and Abstracts Views on Vision4Press platform.
Data correspond to usage on the plateform after 2015. The current usage metrics is available 48-96 hours after online publication and is updated daily on week days.
Initial download of the metrics may take a while.