Fig. 11.
Download original image
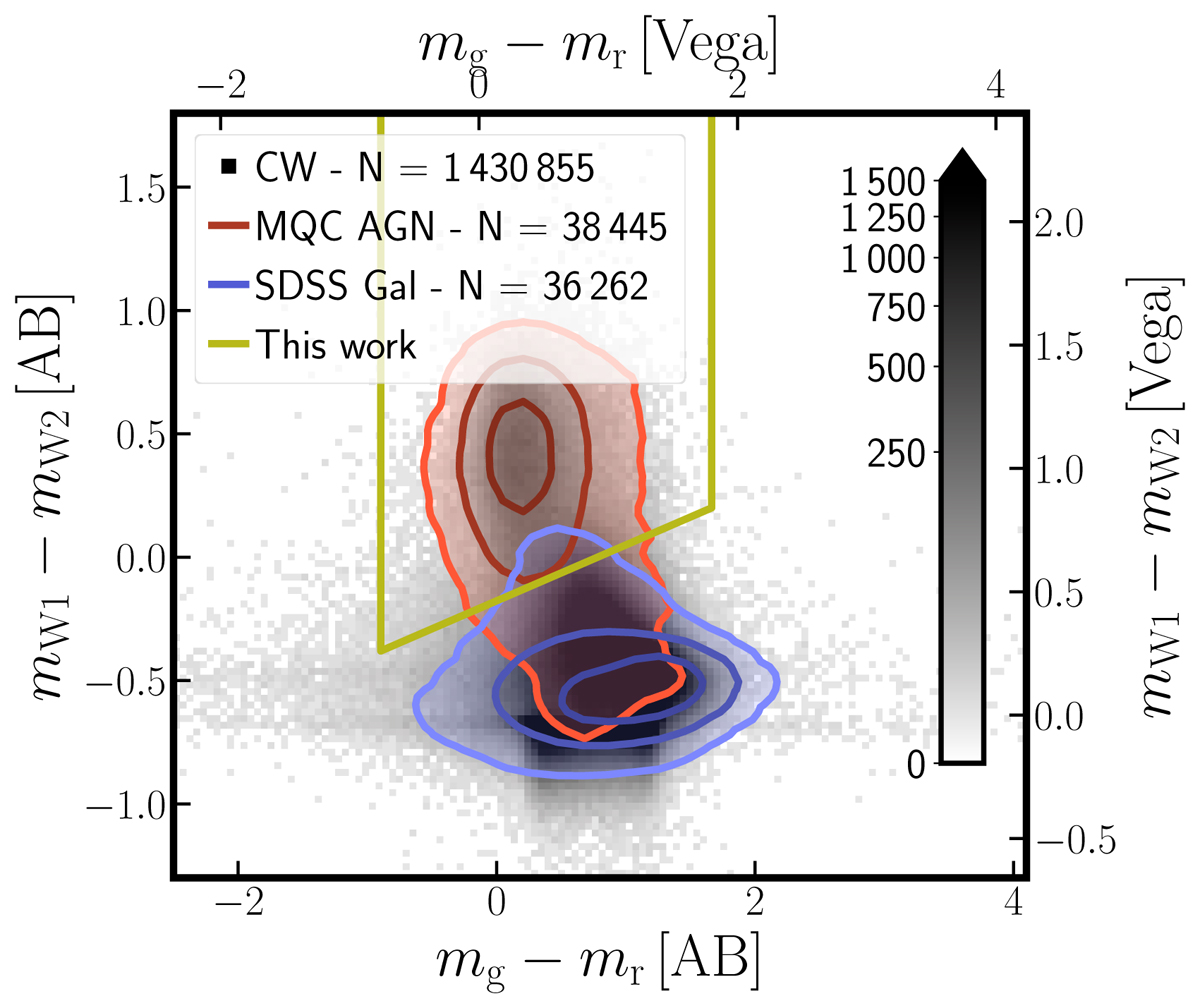
AGN classification colour-colour plot in the HETDEX field using CW (W1, W2) and PS1 (g, r) passbands. Grey-scale density plot include all CW detected and non-imputed sources. Red contours highlight the density distribution of the AGNs in the Million QSO catalogue (MQC) and blue contours show the density distribution for the galaxies from SDSS DR16. Contours are located at 1, 2, and 3σ levels.
Current usage metrics show cumulative count of Article Views (full-text article views including HTML views, PDF and ePub downloads, according to the available data) and Abstracts Views on Vision4Press platform.
Data correspond to usage on the plateform after 2015. The current usage metrics is available 48-96 hours after online publication and is updated daily on week days.
Initial download of the metrics may take a while.