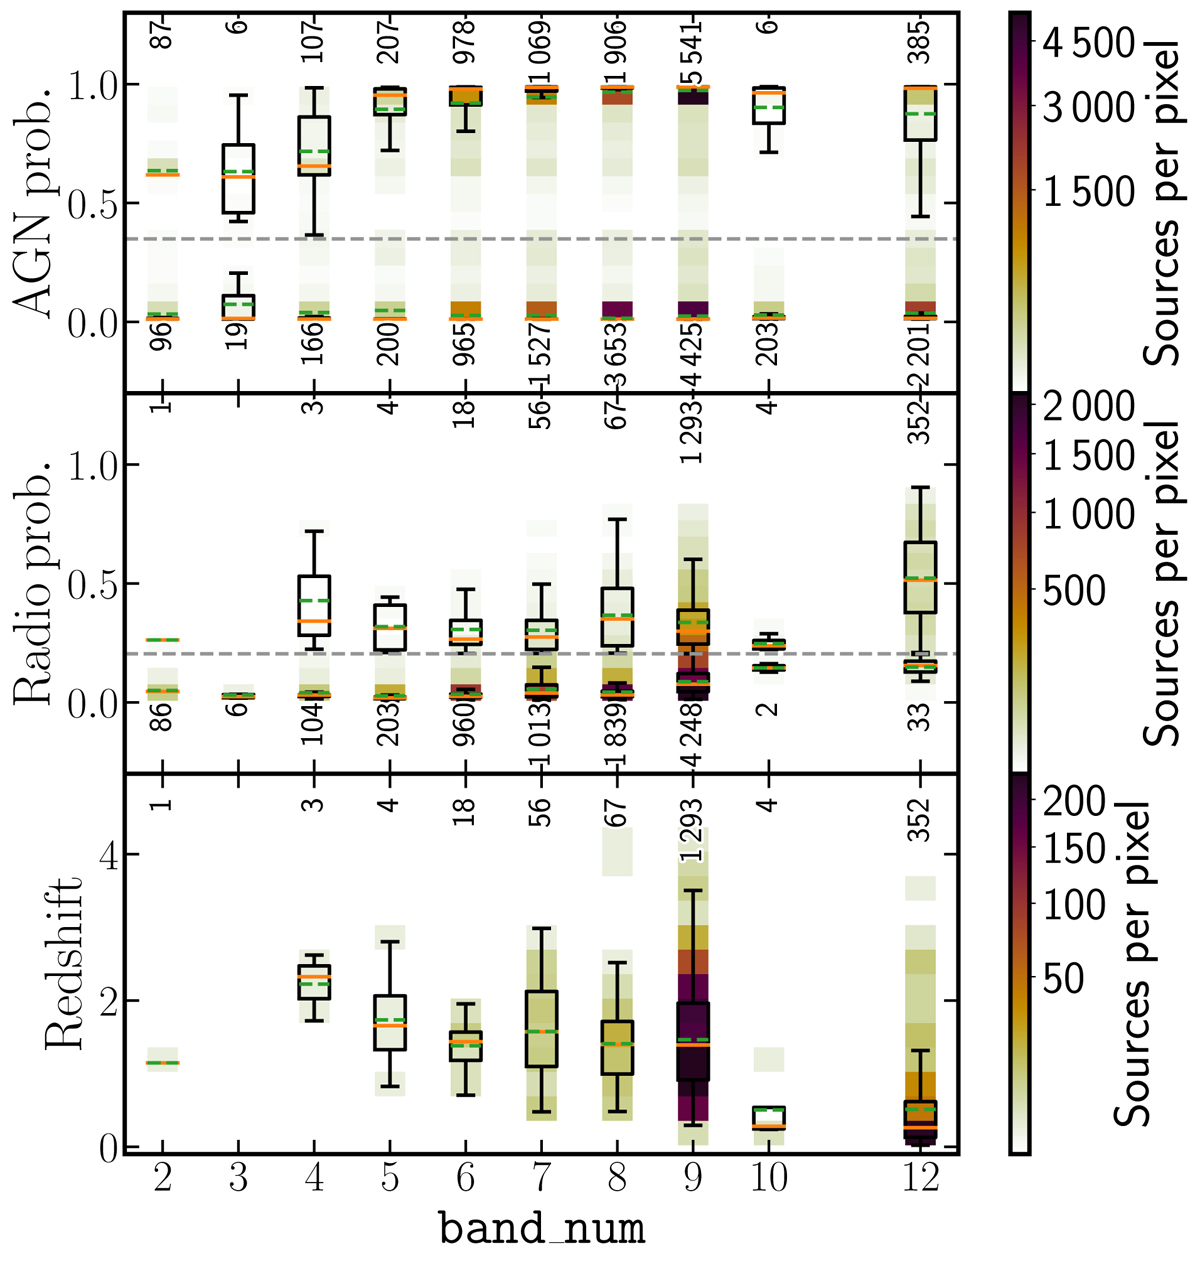
Fig. 10.
Download original image
Evolution of predicted probabilities (top: probability to be AGN, middle: probability of AGNs to be detected in radio) and redshift values for radio-detectable AGNs (bottom panel) as a function of the number of observed bands for sources in test set. In top panel, sources have been divided between those predicted to be AGN and galaxy. In middle panel, sources are divided between predicted AGN that are predicted to be detected in radio and those predicted to not have radio detection. Background density plots (following colour coding in colourbars) show location of predicted values. Overlaid boxplots display main statistics for each number of measured bands. Black rectangles encompass sources in second and third quartiles. Vertical lines show the place of sources from first and fourth quartiles. Orange lines represent median value of sample and dashed, green lines indicate their mean values. Dashed, grey lines show PR thresholds for AGN-galaxy and radio detection classifications. Close to each boxplot, written values correspond to the number of sources considered to create each set of statistics.
Current usage metrics show cumulative count of Article Views (full-text article views including HTML views, PDF and ePub downloads, according to the available data) and Abstracts Views on Vision4Press platform.
Data correspond to usage on the plateform after 2015. The current usage metrics is available 48-96 hours after online publication and is updated daily on week days.
Initial download of the metrics may take a while.