Fig. 6
Download original image
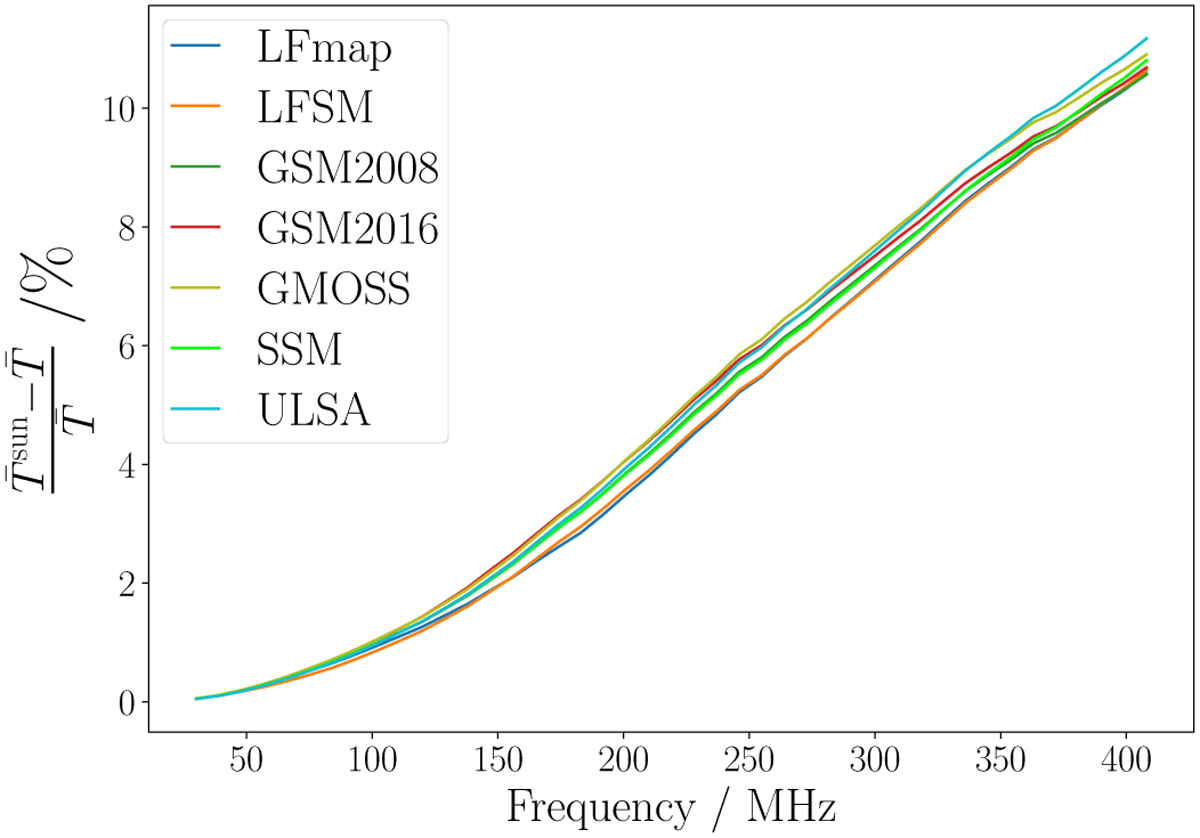
Influence of the Sun on the average sky temperature for each of the models. The plot shows the relative difference of the average sky temperature as a function of the frequency for when a Sun sized circle of the corresponding brightness temperature (quiet Sun) is added to the maps. Kinks in the curves are due to quantization effects in the calculations.
Current usage metrics show cumulative count of Article Views (full-text article views including HTML views, PDF and ePub downloads, according to the available data) and Abstracts Views on Vision4Press platform.
Data correspond to usage on the plateform after 2015. The current usage metrics is available 48-96 hours after online publication and is updated daily on week days.
Initial download of the metrics may take a while.