Open Access
Fig. 5
Download original image
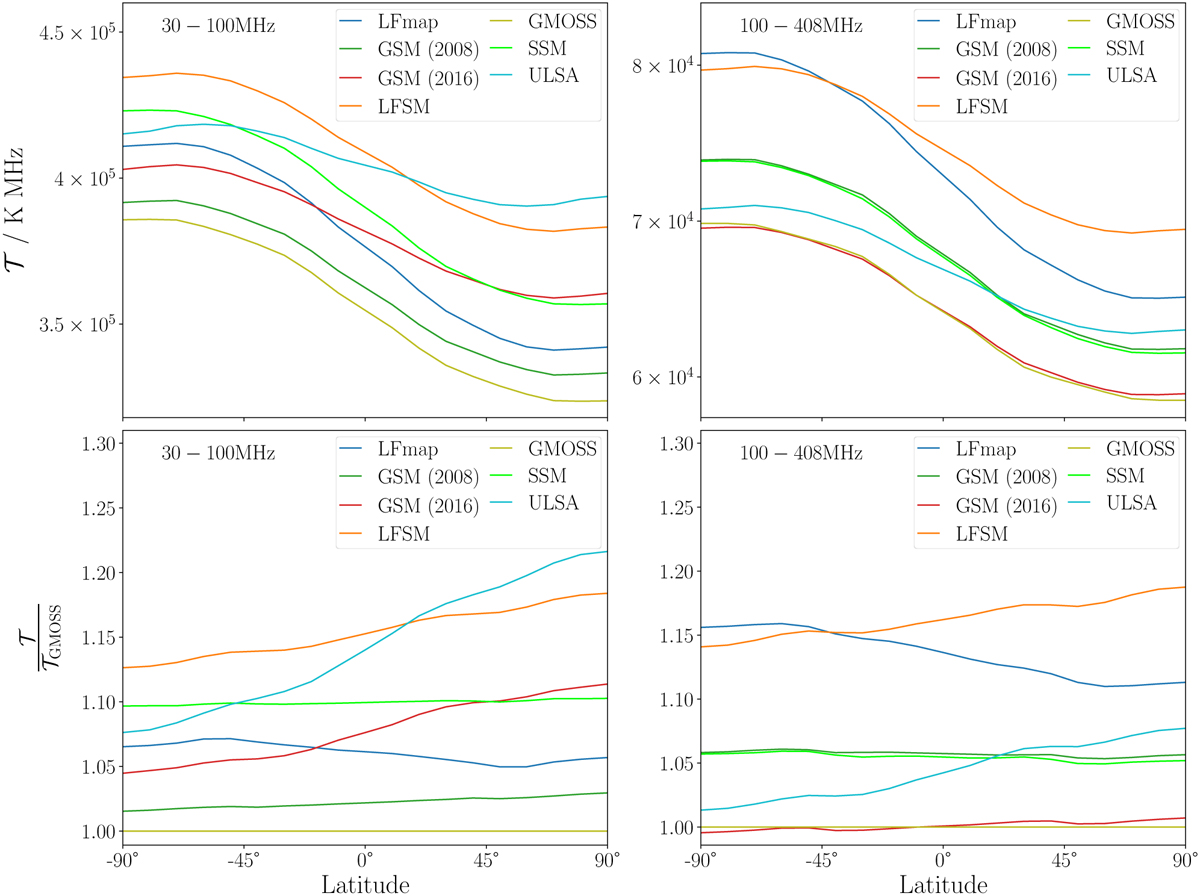
Values of 𝒯(ℓ) for each sky interpolation models as a function of latitude. The results for the frequency ranges [30 MHz, 100 MHz] and [100 MHz, 408 MHz] are shown on the left and right side, respectively. In the top row, absolute values are shown while in the bottom row, values are normalized to GMOSS.
Current usage metrics show cumulative count of Article Views (full-text article views including HTML views, PDF and ePub downloads, according to the available data) and Abstracts Views on Vision4Press platform.
Data correspond to usage on the plateform after 2015. The current usage metrics is available 48-96 hours after online publication and is updated daily on week days.
Initial download of the metrics may take a while.