Fig. 3
Download original image
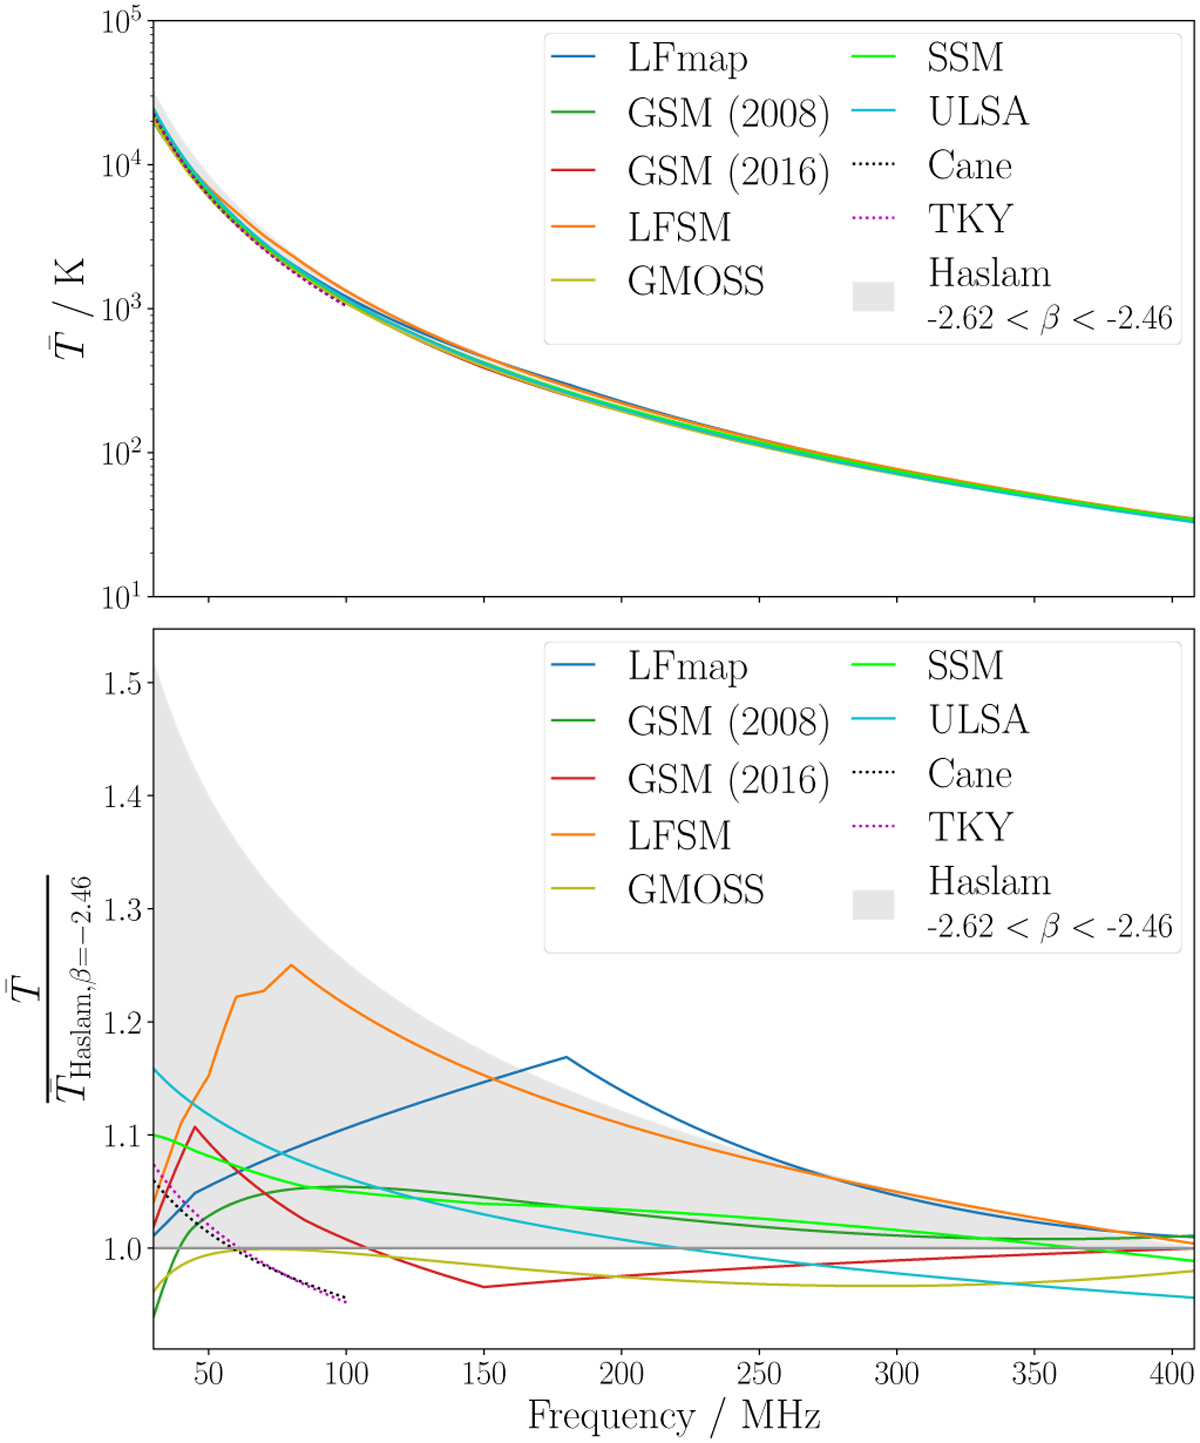
Average sky temperature as a function of the frequency is plotted for the interpolation models as solid lines and for the parameterizations Cane and TKY as dashed lines. The gray band shows the results for the 408 MHz Haslam map when scaled down with a spectral index β between −2.62 and −2.46. The upper plot shows the absolute values, while in the lower plot the results are normalized to those for the scaled Haslam map and a spectral index β = −2.46.
Current usage metrics show cumulative count of Article Views (full-text article views including HTML views, PDF and ePub downloads, according to the available data) and Abstracts Views on Vision4Press platform.
Data correspond to usage on the plateform after 2015. The current usage metrics is available 48-96 hours after online publication and is updated daily on week days.
Initial download of the metrics may take a while.