Fig. 33
Download original image
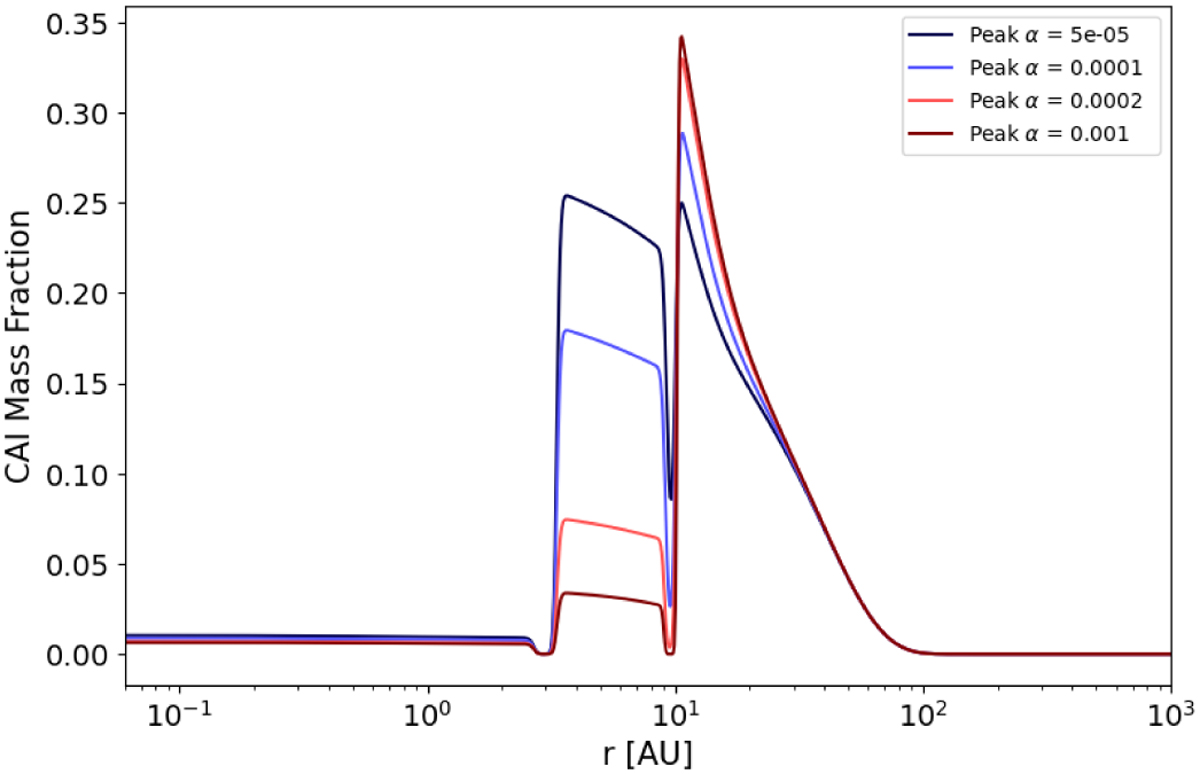
Final CAI abundance profile after 5 Myr with variations of αpeak, which controls the depth of the planet gap. Higher values increase the gradient in the gas surface density and hence lead to a stronger pressure gradient pushing CAIs back towards the pressure bump. This reduces the amount of CAIs passing through and thus lowers the CAI abundance in the region in between the two planets. A rapid transition seems to occur between αpeak = 1 × 10⁻⁴ and 2 × 10⁻⁴.
Current usage metrics show cumulative count of Article Views (full-text article views including HTML views, PDF and ePub downloads, according to the available data) and Abstracts Views on Vision4Press platform.
Data correspond to usage on the plateform after 2015. The current usage metrics is available 48-96 hours after online publication and is updated daily on week days.
Initial download of the metrics may take a while.