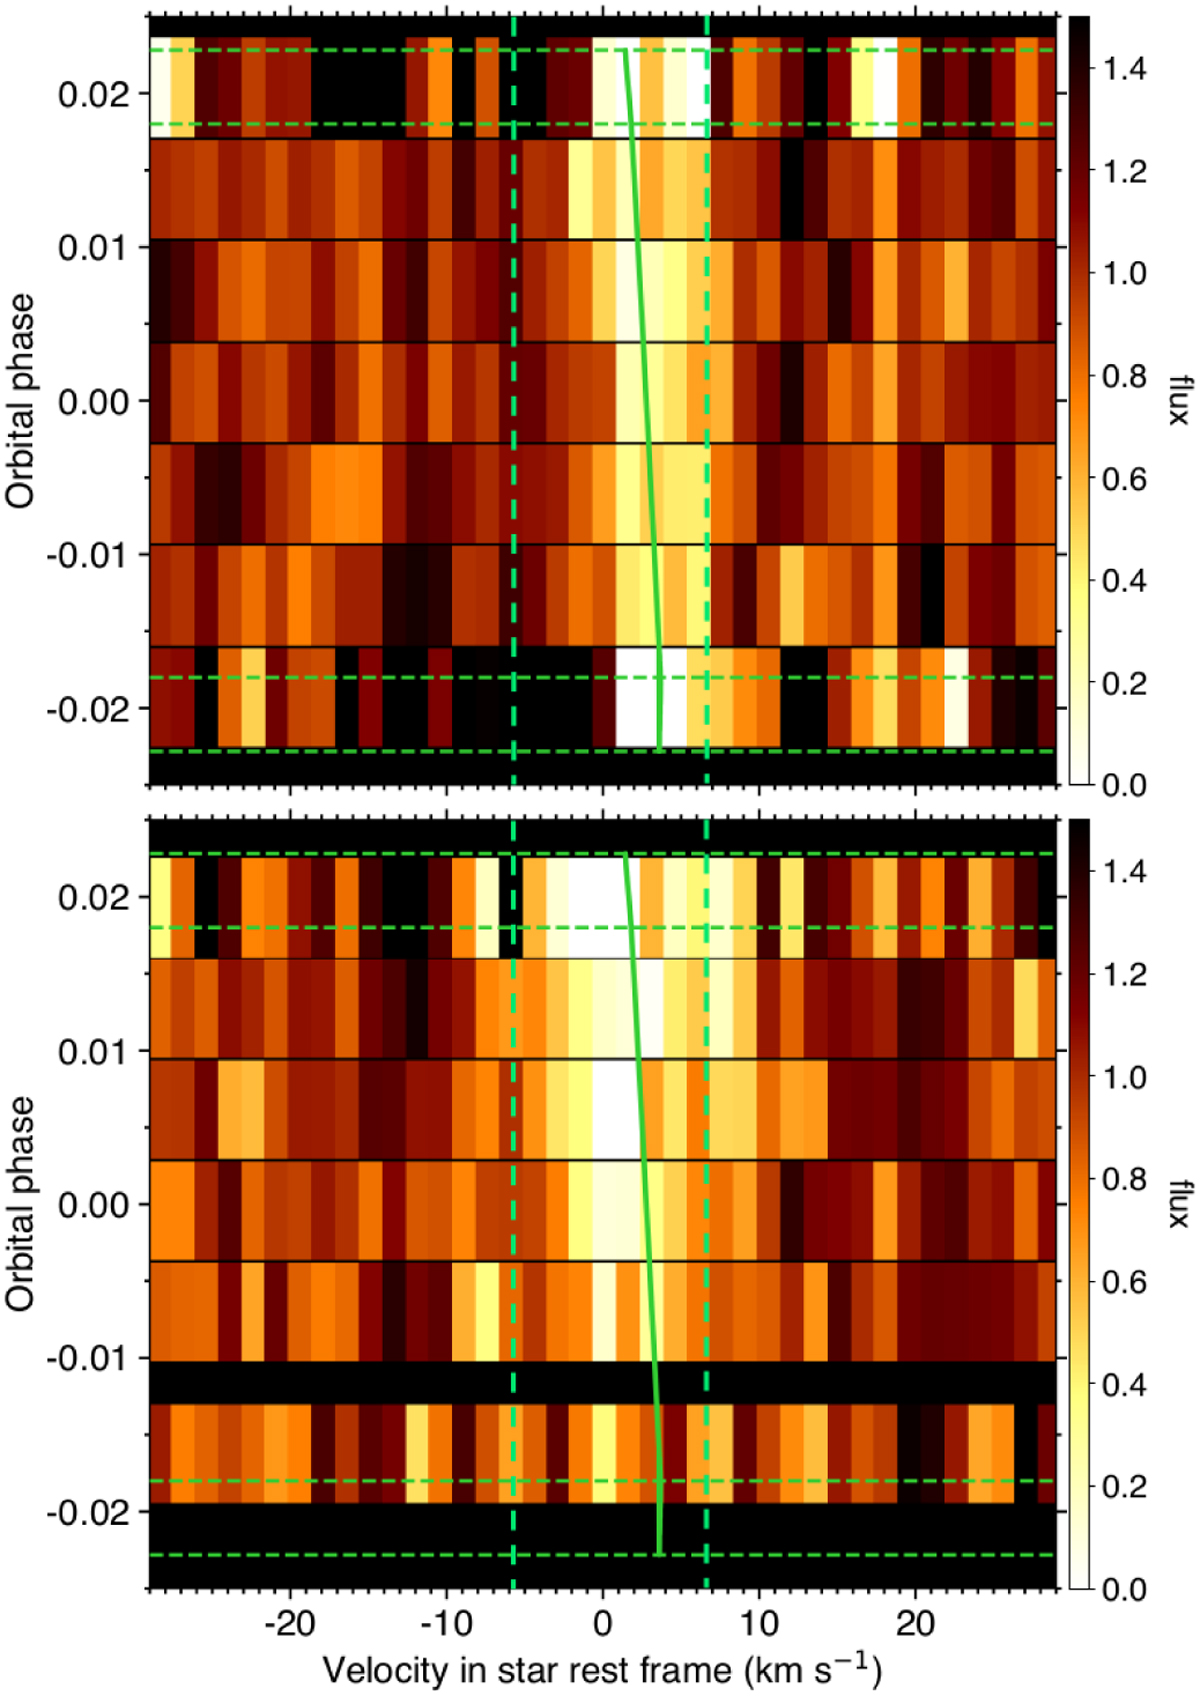
Fig. 6
Download original image
Maps of the CCFintr during the transit of TOI-858 B b in Visit 1 (upper panel) and Visit 2 (lower panel). Transit contacts are shown as green horizontal dashed lines. Values are coloured as a function of their normalised flux and plotted as a function of RV in the stellar rest frame (in abscissa) and orbital phase (in ordinate). The stellar lines from the planet-occulted regions are clearly visible in both visits. The green solid lines show the best-fit model for the stellar surface RVs derived from a joint RMR fit to both data sets. The green vertical dashed lines show the spectroscopic, sky-projected stellar rotational velocity.
Current usage metrics show cumulative count of Article Views (full-text article views including HTML views, PDF and ePub downloads, according to the available data) and Abstracts Views on Vision4Press platform.
Data correspond to usage on the plateform after 2015. The current usage metrics is available 48-96 hours after online publication and is updated daily on week days.
Initial download of the metrics may take a while.