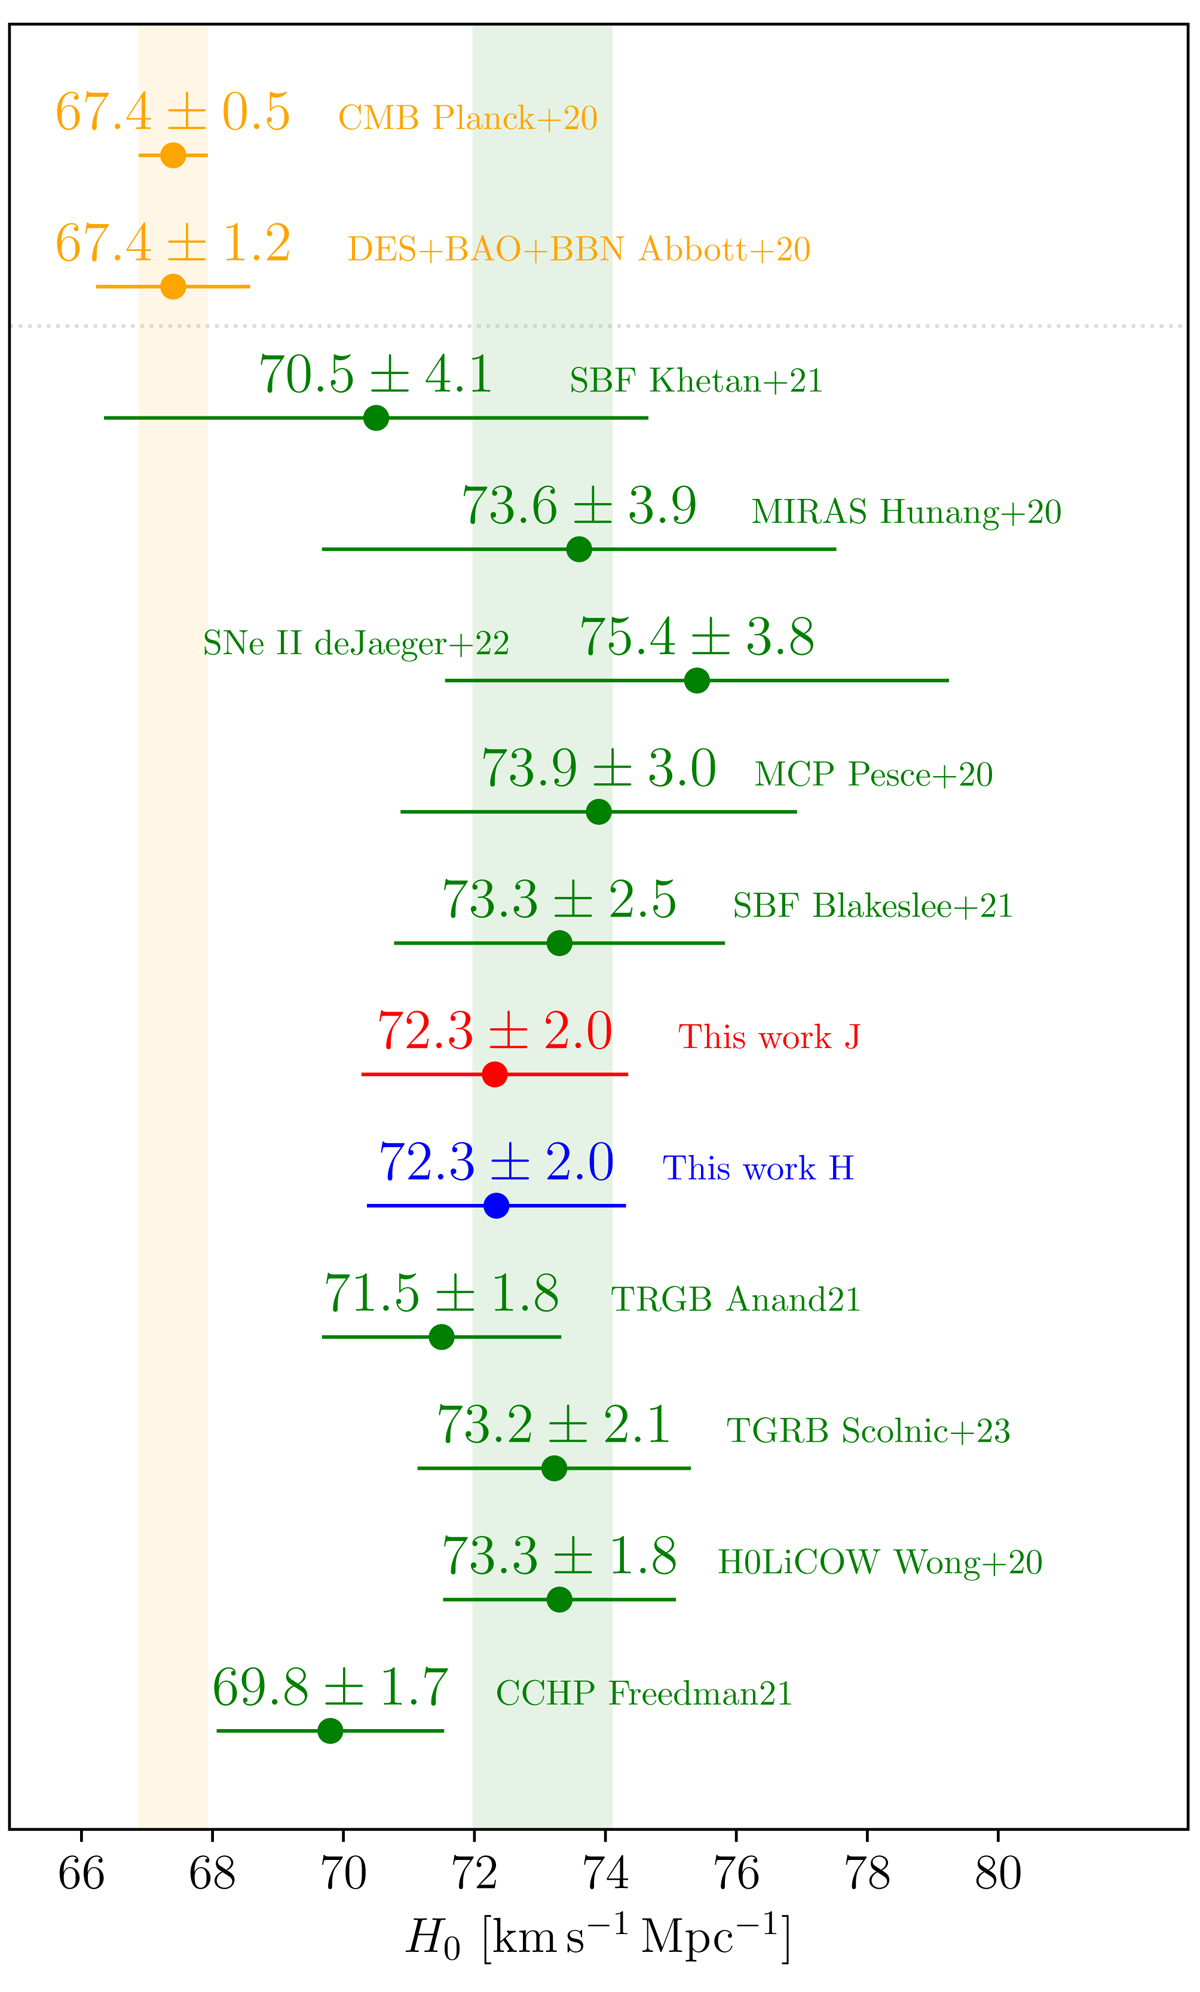
Fig. 8.
Download original image
Summary plot of the latest measurements of H0 using several different techniques from the early (in orange) and late (in green) Universe. The vertical colored strips represent the reference early Universe value by the Planck satellite and the late Universe value from SH0ES. The late Universe measurements are sorted by the size of the uncertainty, from top to bottom. Our measurements are included in red (for J) and blue (for H).
Current usage metrics show cumulative count of Article Views (full-text article views including HTML views, PDF and ePub downloads, according to the available data) and Abstracts Views on Vision4Press platform.
Data correspond to usage on the plateform after 2015. The current usage metrics is available 48-96 hours after online publication and is updated daily on week days.
Initial download of the metrics may take a while.