Fig. 6.
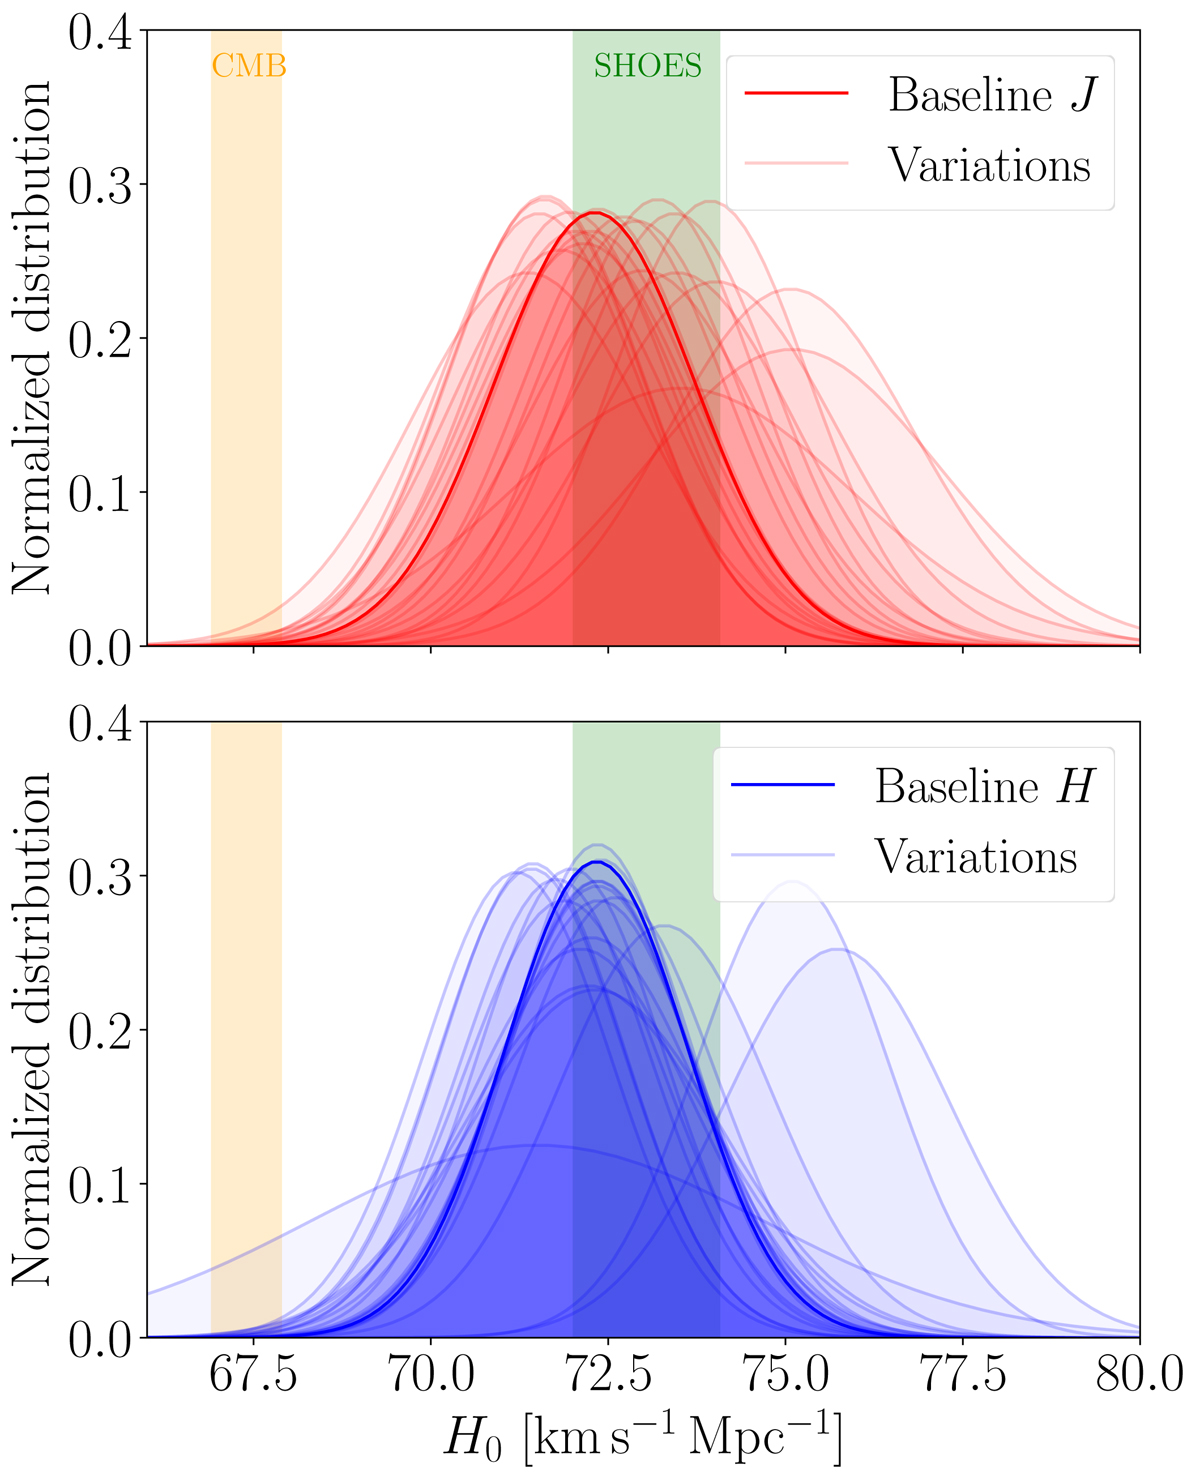
Download original image
Probability Gaussian densities of our baseline analysis (solid) and the 21 variations performed in Sect. 5.1. The two vertical strips correspond to the 1σ uncertainties around the best H0 value from the Planck Collaboration VI (2020) and the SH0ES project (R22). The results with the J-band are in the upper panel and with the H-band in the lower panel.
Current usage metrics show cumulative count of Article Views (full-text article views including HTML views, PDF and ePub downloads, according to the available data) and Abstracts Views on Vision4Press platform.
Data correspond to usage on the plateform after 2015. The current usage metrics is available 48-96 hours after online publication and is updated daily on week days.
Initial download of the metrics may take a while.