Open Access
Fig. 4.
Download original image
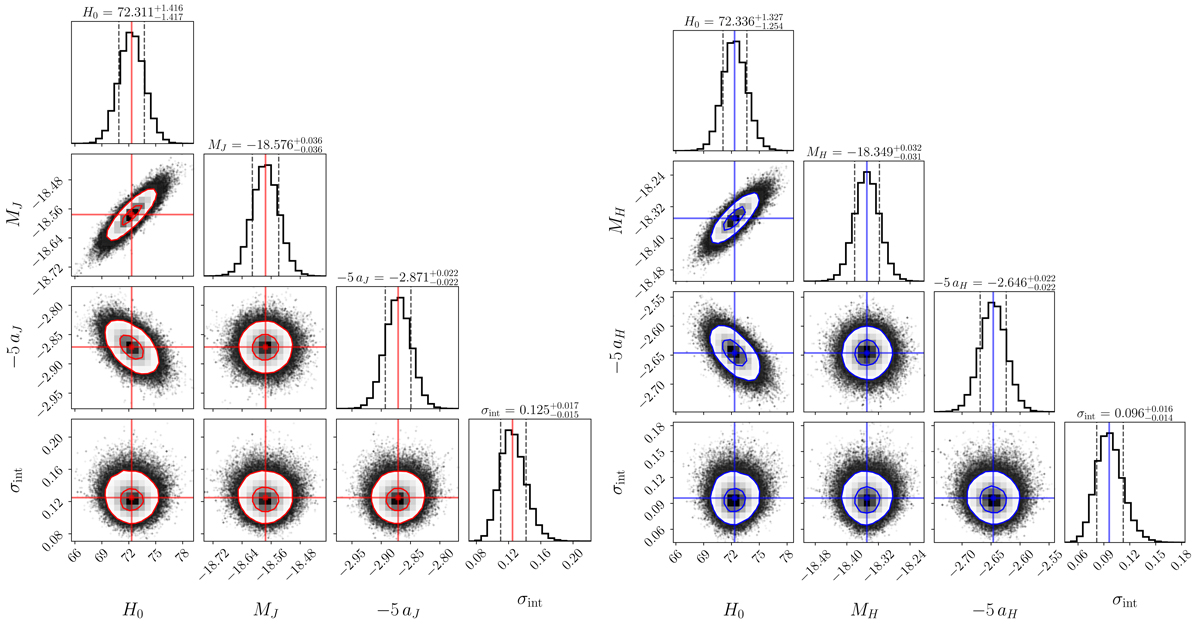
Corner plot with the results of the MCMC posteriors of our baseline analysis. The results for the J-band are on the left and for the H-band are on the right. The red and blue contours on the scatter plots correspond to 1σ and 2σ of the 2D distributions, and the vertical and horizontal lines the medians of the posteriors.
Current usage metrics show cumulative count of Article Views (full-text article views including HTML views, PDF and ePub downloads, according to the available data) and Abstracts Views on Vision4Press platform.
Data correspond to usage on the plateform after 2015. The current usage metrics is available 48-96 hours after online publication and is updated daily on week days.
Initial download of the metrics may take a while.