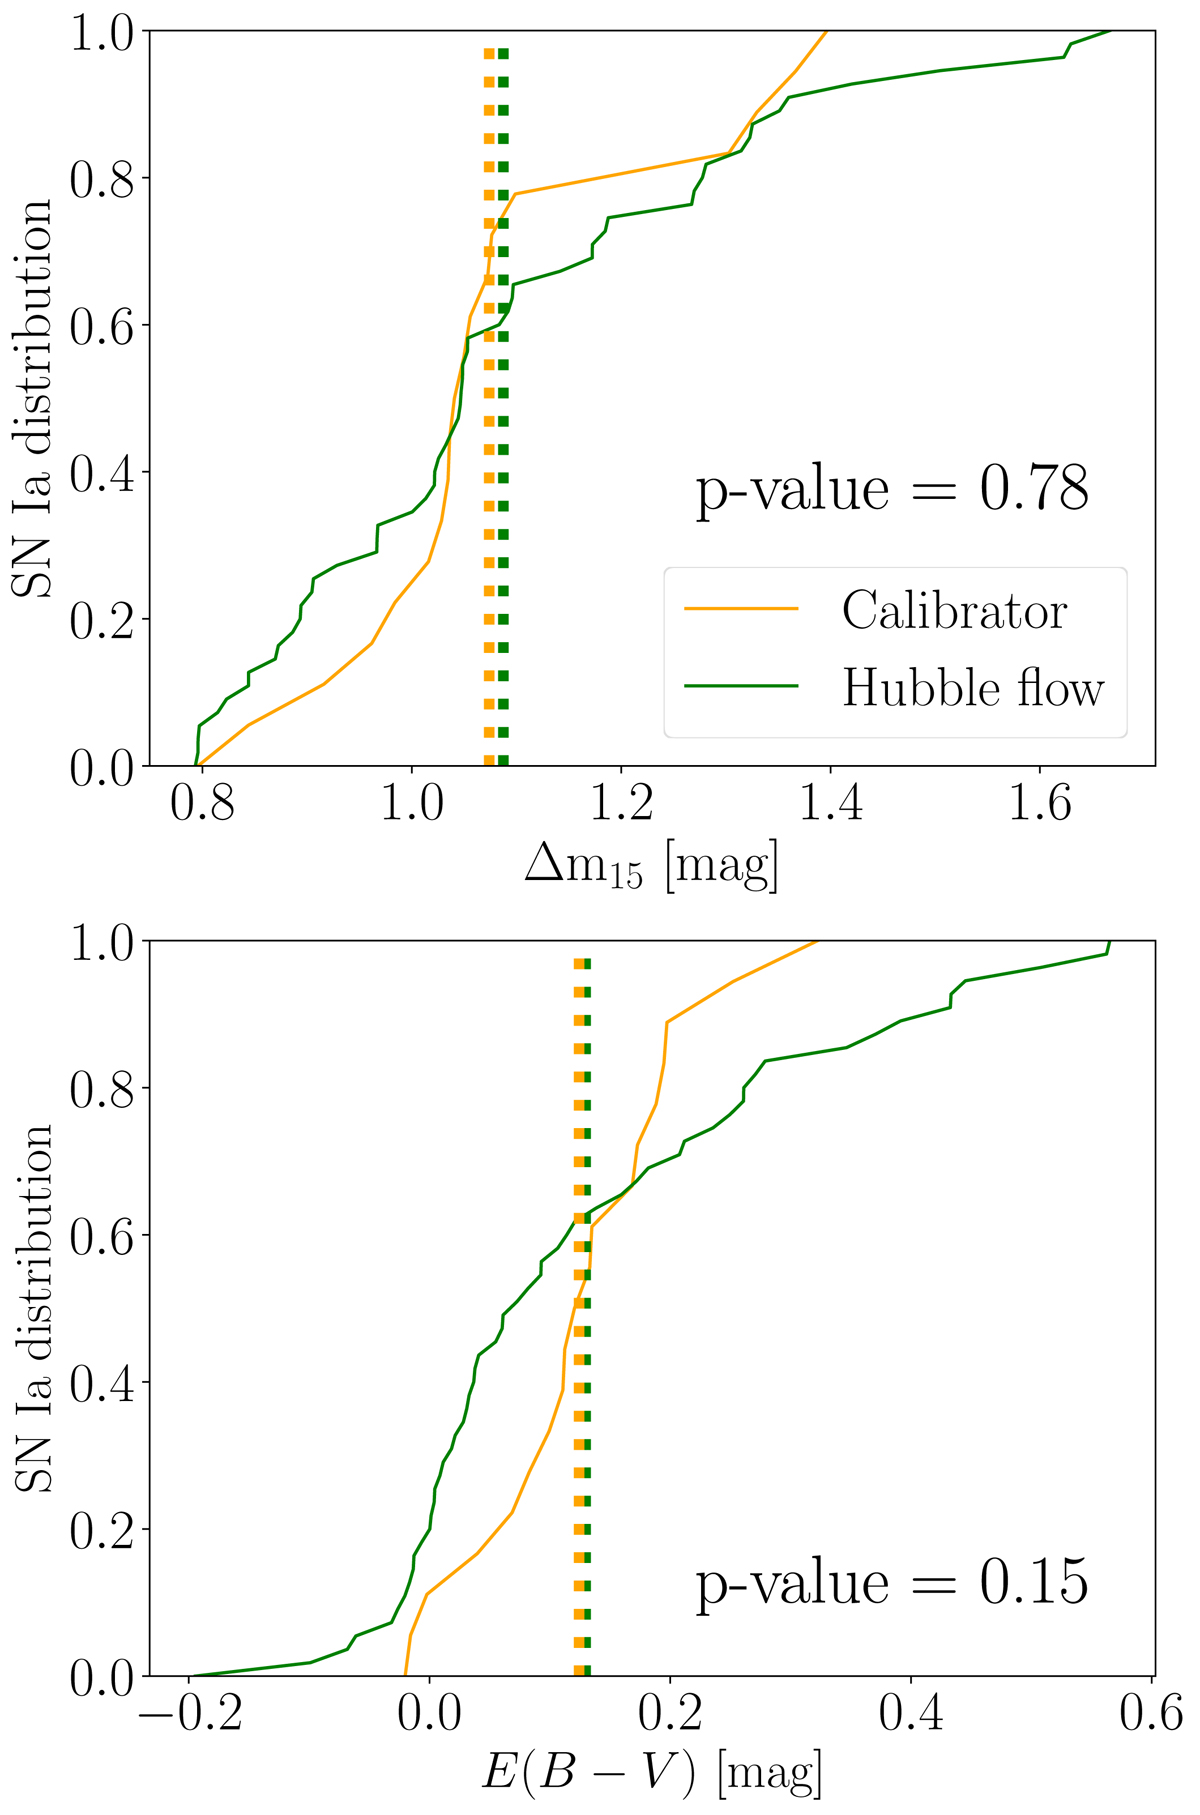
Fig. 3.
Download original image
Distributions of #x0394;m15 light curve width parameter (top) and color excess at peak E(B − V) (bottom) of the calibrator (in orange) and Hubble-flow (in green) SN Ia samples obtained from SNooPY fitting UV, optical, and NIR light curves simultaneously with the EBV_model2. Vertical dashed lines represent the average value of the distributions. The p-value of the two-sample K–S test is included in each panel.
Current usage metrics show cumulative count of Article Views (full-text article views including HTML views, PDF and ePub downloads, according to the available data) and Abstracts Views on Vision4Press platform.
Data correspond to usage on the plateform after 2015. The current usage metrics is available 48-96 hours after online publication and is updated daily on week days.
Initial download of the metrics may take a while.