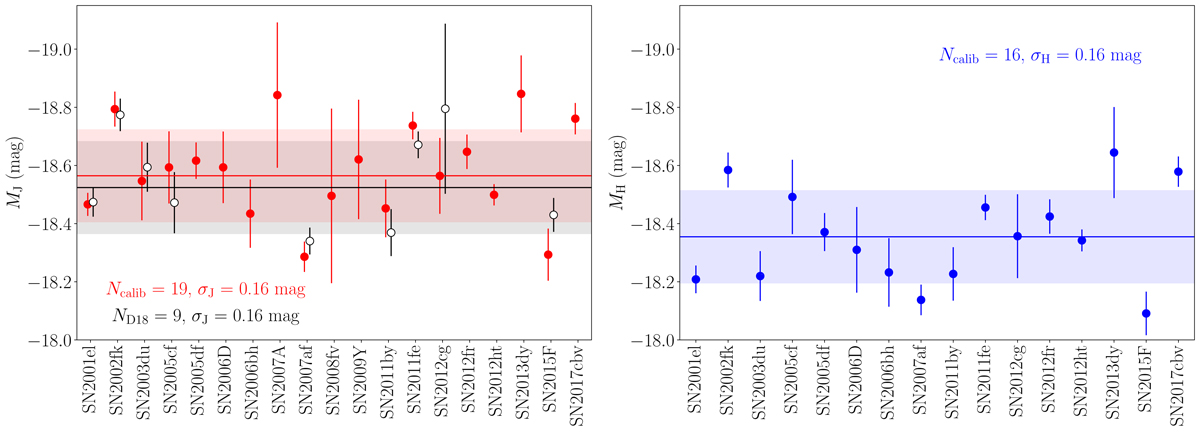
Fig. 1.
Download original image
Absolute magnitudes of the SNe Ia in the calibrator sample for the J-band (left) and H-band (right). The horizontal lines represent the weighted average and the strip the standard deviation around that value. In the left panel we included the nine SN Ia included in D18 for reference. Uncertainties correspond to those described in Sect. 3.5 and do not include the σint term added in quadrature.
Current usage metrics show cumulative count of Article Views (full-text article views including HTML views, PDF and ePub downloads, according to the available data) and Abstracts Views on Vision4Press platform.
Data correspond to usage on the plateform after 2015. The current usage metrics is available 48-96 hours after online publication and is updated daily on week days.
Initial download of the metrics may take a while.