Fig. 7.
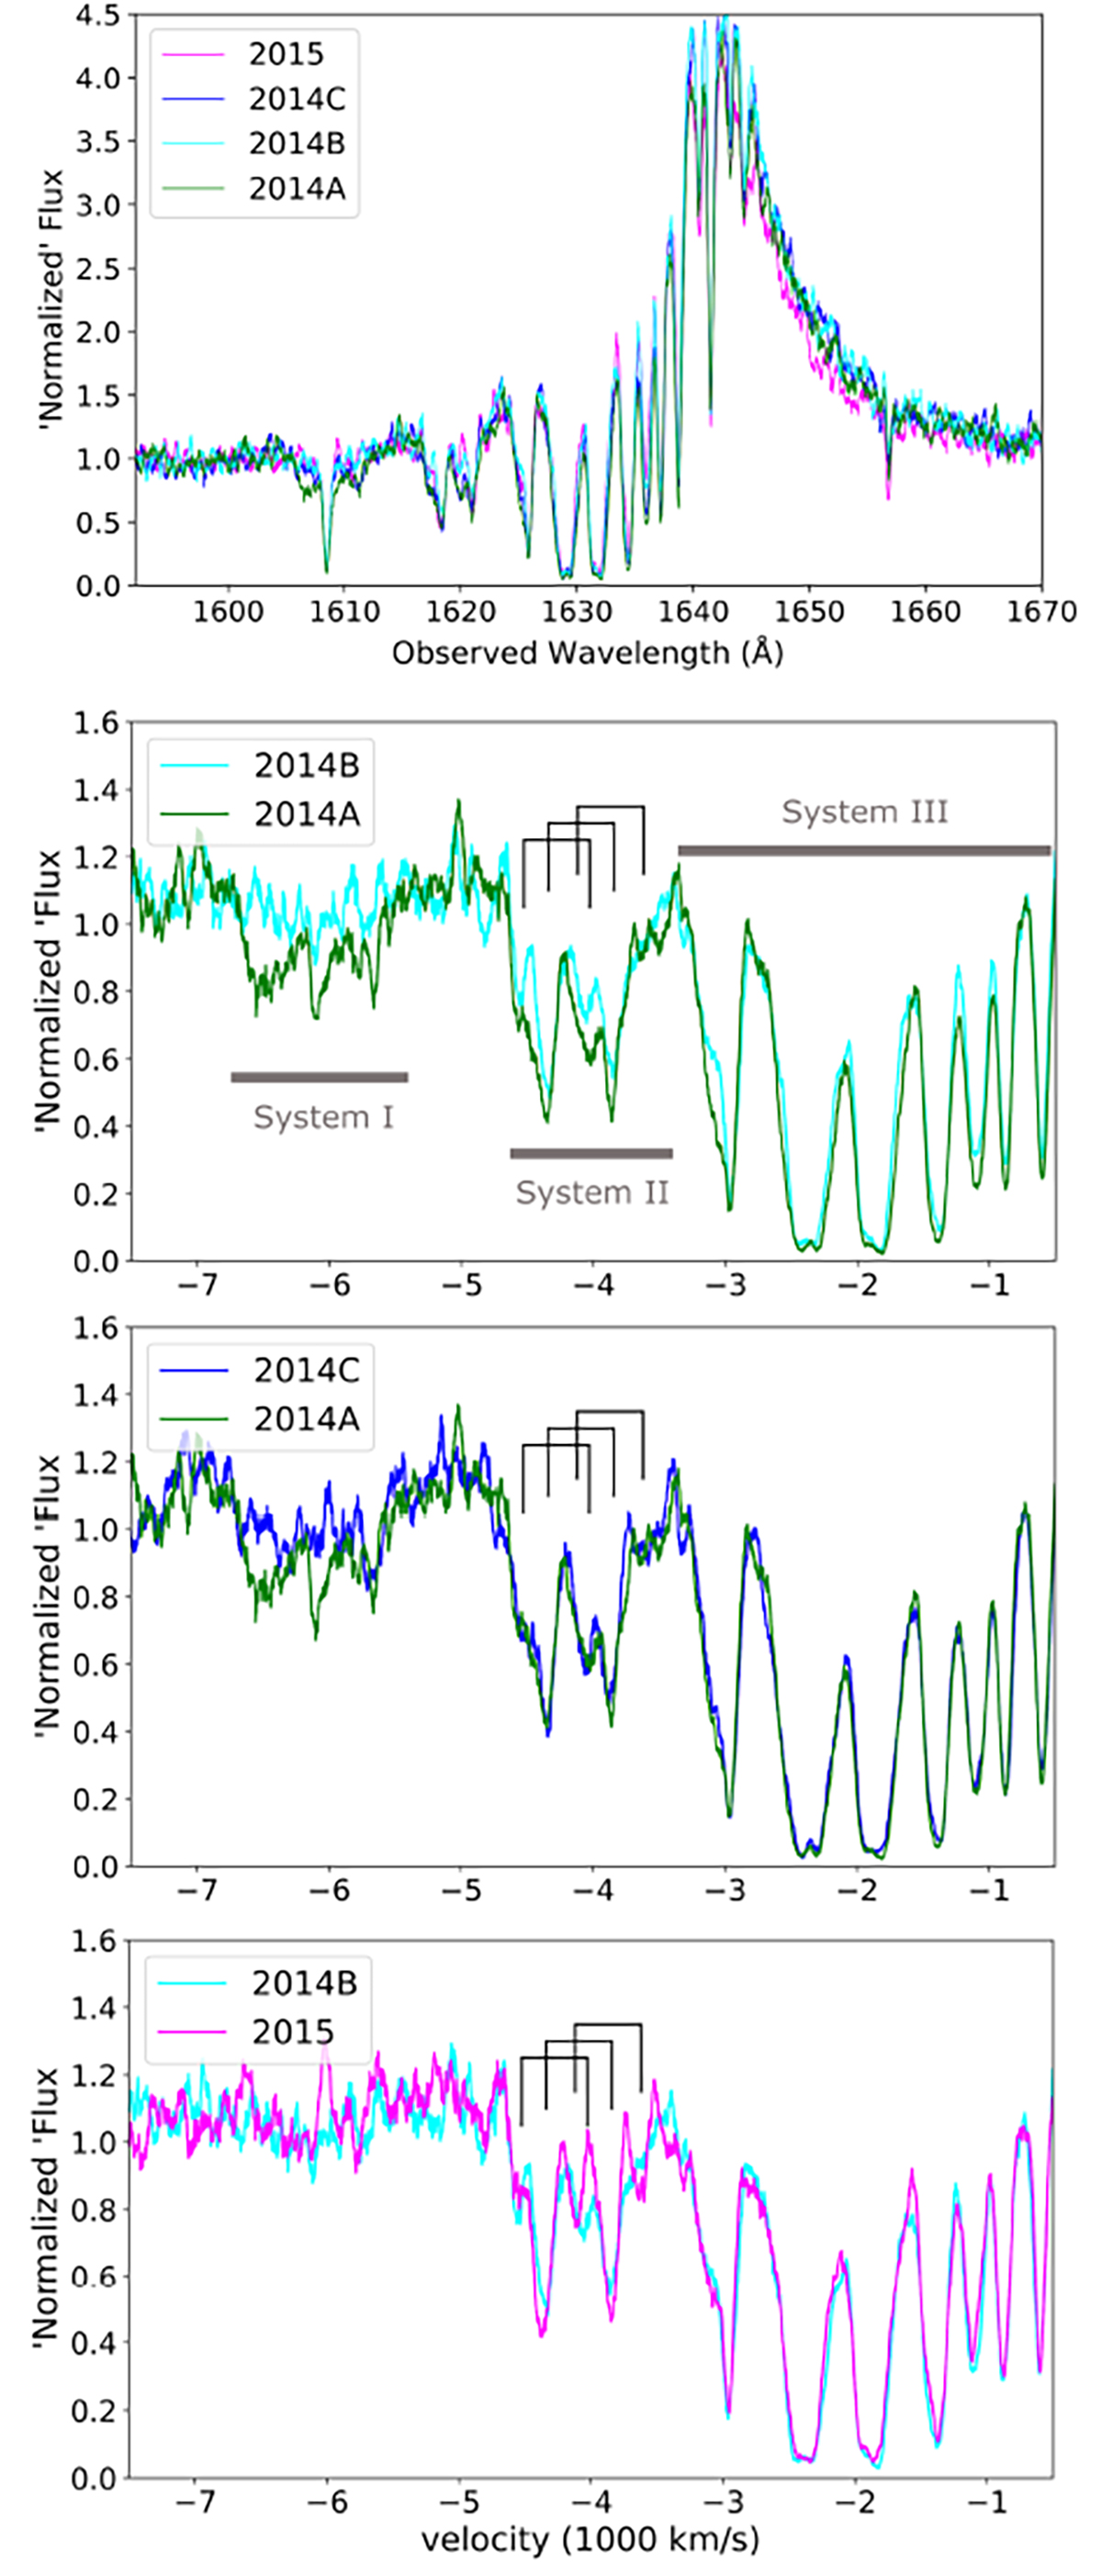
Download original image
HST-COS spectra o C IV region of PG 1126-041 taken between 2014 and 2015. Top panel: four spectra are plotted overlapped after being normalized and matched at 1595 − 1605 Å to show both changes in emission and absorption. Bottom three panels: zoomed-in view of the 1600 − 1640 Å region, comparing different couples of epochs in velocity scale, after normalization using a second-order polynomial fit. Three velocity systems are marked, as well as three likely C IV doublets in system II. The strong absorption line at 1608 Å is due to Galactic Fe II and was removed prior to the measurements, so it does not appear in the bottom three panels. All spectra in this figure have been smoothed with a boxcar filter with a width of 31 pixels (corresponding to less than 0.4 Å or 75 km s−1) for visualization purposes.
Current usage metrics show cumulative count of Article Views (full-text article views including HTML views, PDF and ePub downloads, according to the available data) and Abstracts Views on Vision4Press platform.
Data correspond to usage on the plateform after 2015. The current usage metrics is available 48-96 hours after online publication and is updated daily on week days.
Initial download of the metrics may take a while.