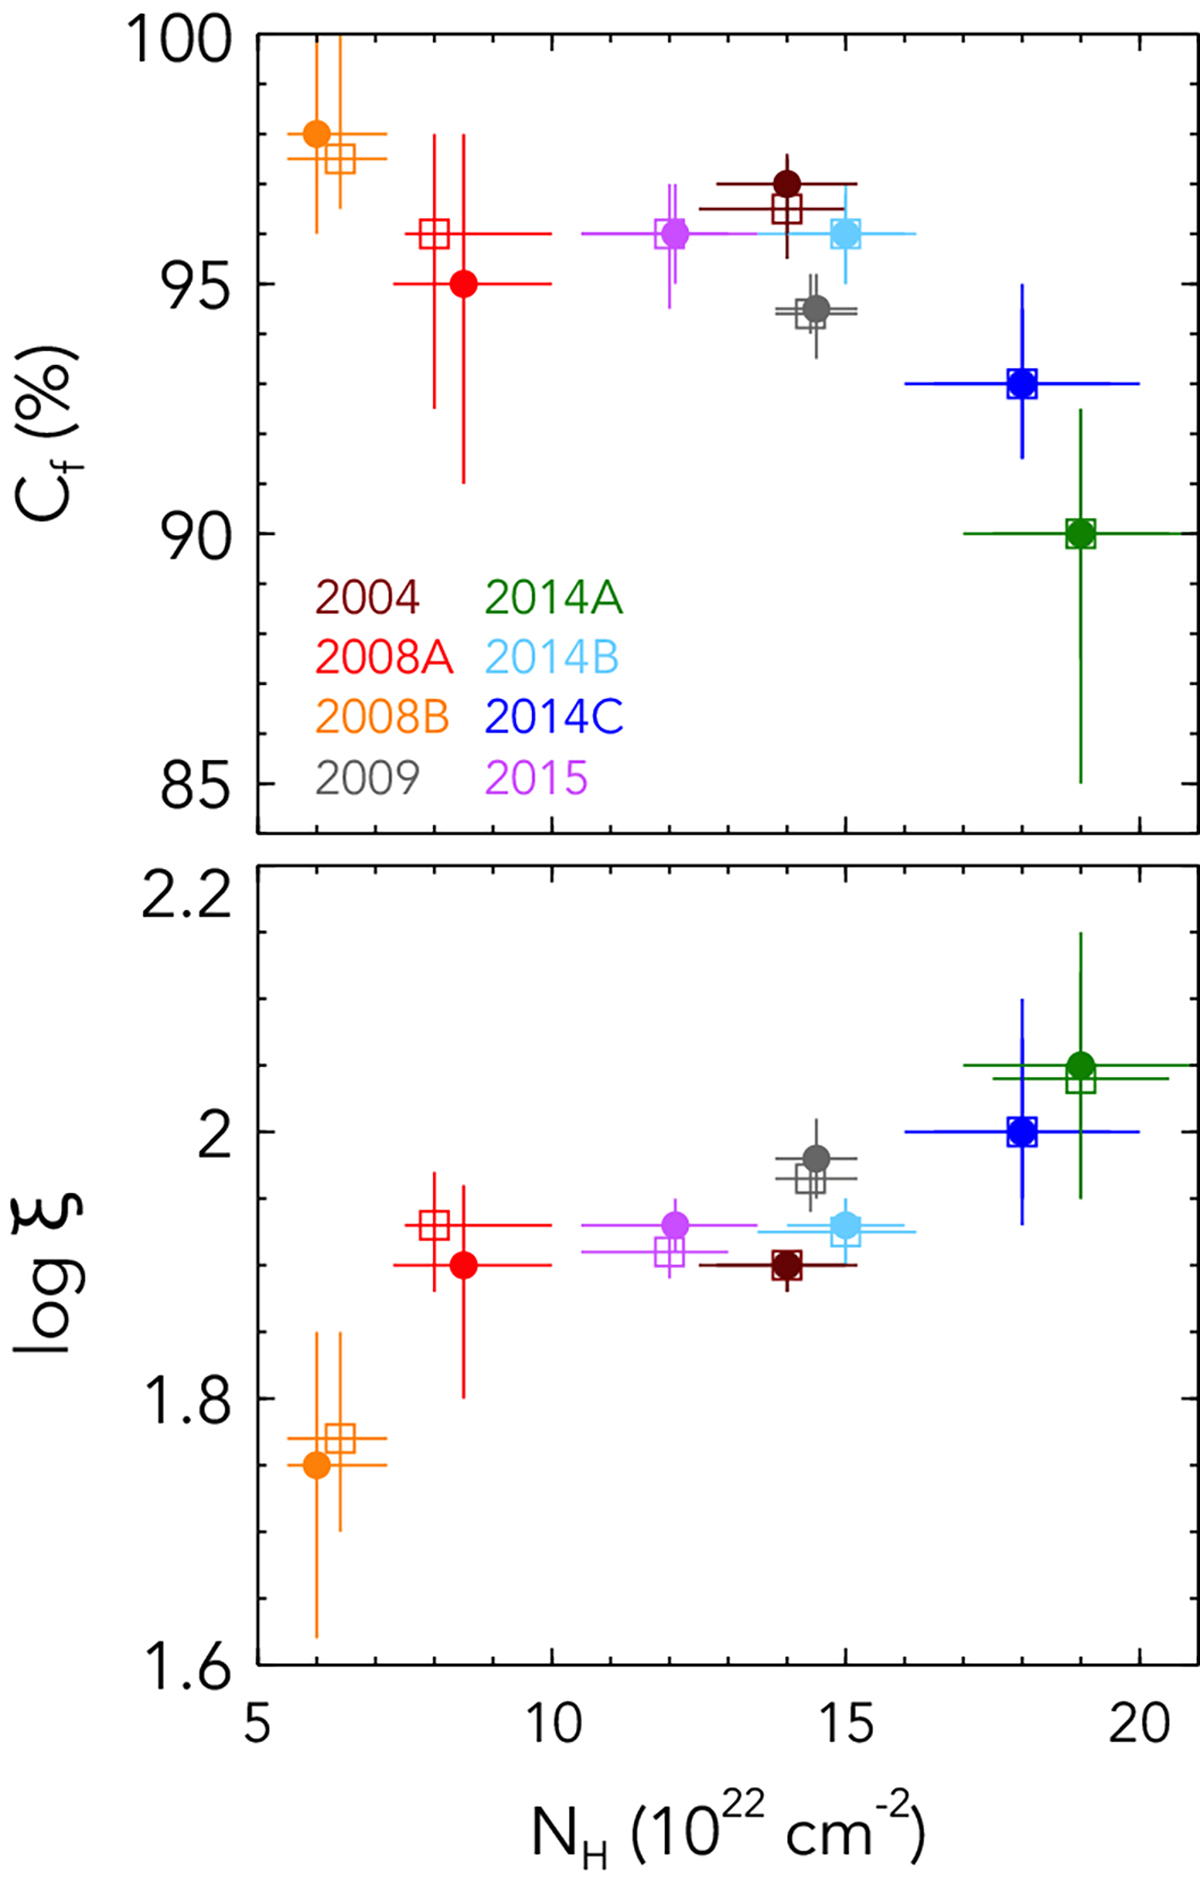
Fig. 6.
Download original image
Column density of partially covering X-ray absorber versus its covering fraction (top panel) and ionization parameter (bottom panel), derived from the Bayesian analysis of the EPIC-pn spectra in different epochs assuming the phenomenological model (empty squares) or the disk wind model (filled circles). Error bars represent 2σ deviations from the median posterior probability distribution of the parameters.
Current usage metrics show cumulative count of Article Views (full-text article views including HTML views, PDF and ePub downloads, according to the available data) and Abstracts Views on Vision4Press platform.
Data correspond to usage on the plateform after 2015. The current usage metrics is available 48-96 hours after online publication and is updated daily on week days.
Initial download of the metrics may take a while.