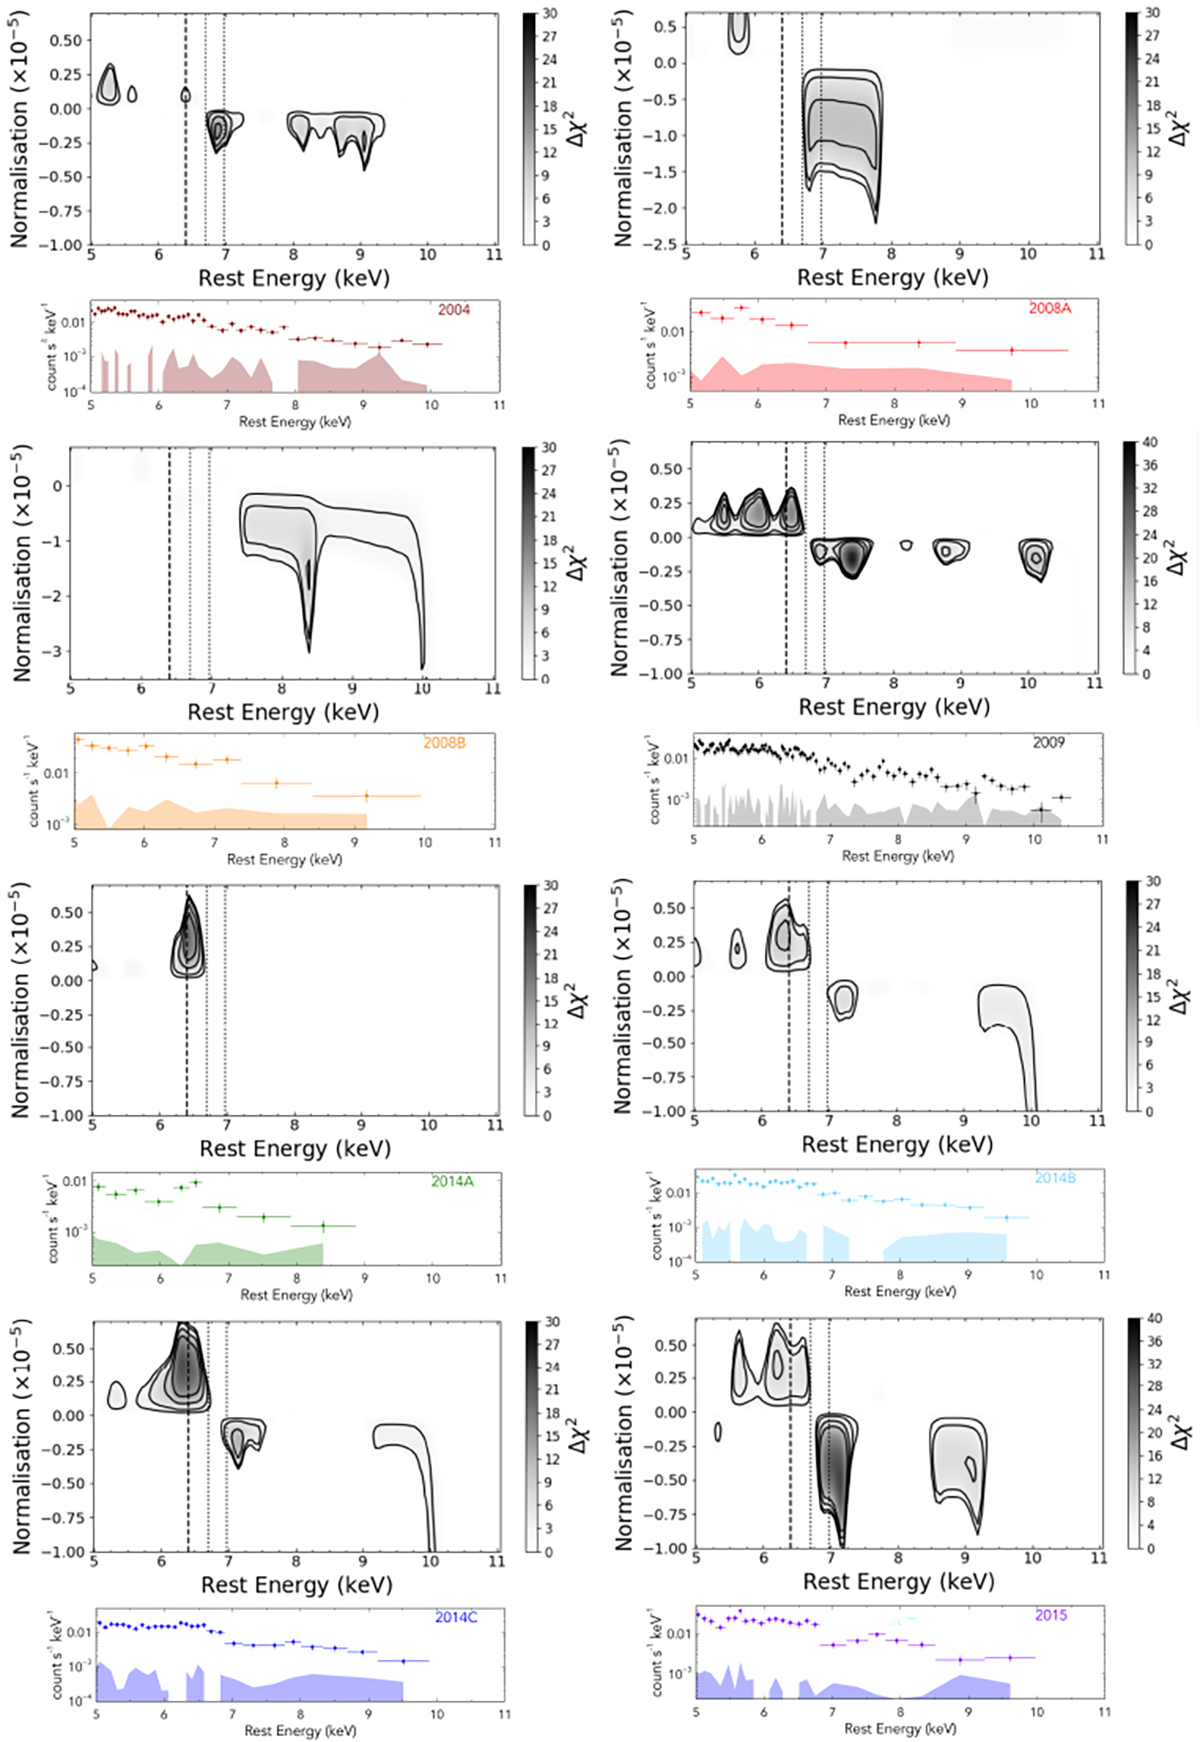
Fig. 4.
Download original image
Results of the scan of χ2 statistical spaces between 5 and 11 keV with a Gaussian line. Top panels: confidence contours at (from the outermost to the innermost) 68%, 90%, 99%, and 99.9% significance levels for the centroid energy and normalization of a Gaussian emission or absorption line applied to the baseline model [(partcov*xstar500)*pow]. The contours are filled with a color intensity proportional to the Δχ2 represented in the color map to the right of each panel. The three dashed vertical lines mark the rest-frame energy of Fe I, Fe XXV, and Fe XXVI Kα transitions. We note the different y-axes in the 2008A and 2008B panels. Bottom panels: observed spectra (filled circles) and corresponding background (shaded area).
Current usage metrics show cumulative count of Article Views (full-text article views including HTML views, PDF and ePub downloads, according to the available data) and Abstracts Views on Vision4Press platform.
Data correspond to usage on the plateform after 2015. The current usage metrics is available 48-96 hours after online publication and is updated daily on week days.
Initial download of the metrics may take a while.