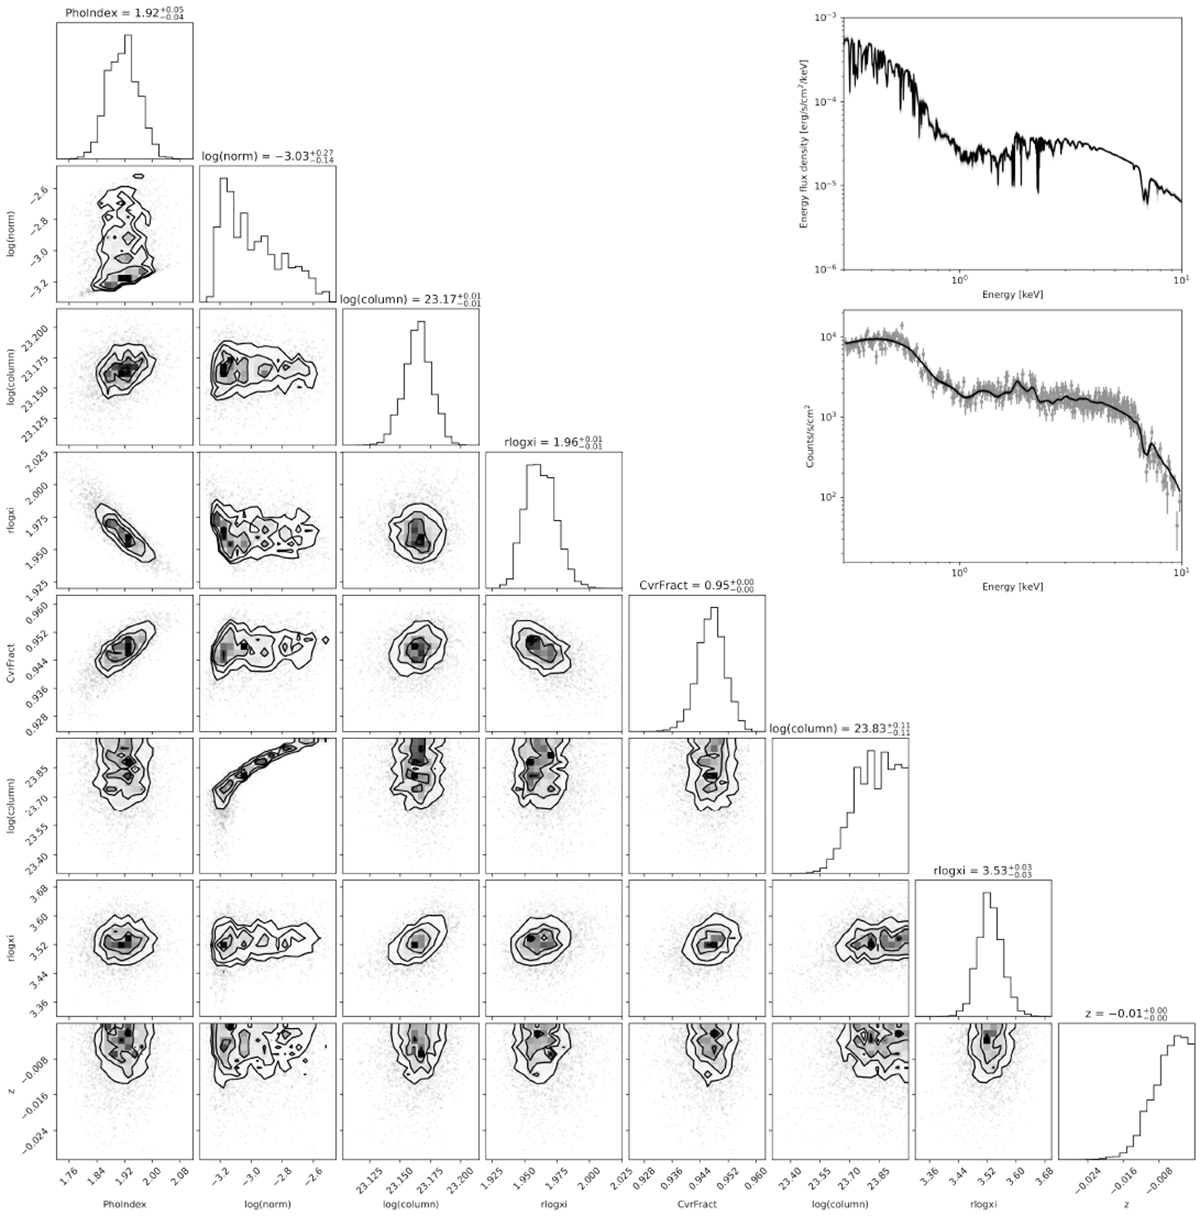
Fig. A.1.
Download original image
Bayesian analysis results for the parameters of the model [(partcov*xstar500)*(xstar5000*pow)] given the 2009 data. The corner plot reports the 1D (histograms) and 2D (credible contours) posterior probability distributions for the model parameters. The top right panels report the posterior probability distributions of the theoretical model (top) and of the model convolved with the instrumental response, with the binned EPIC-pn data overplotted (bottom).
Current usage metrics show cumulative count of Article Views (full-text article views including HTML views, PDF and ePub downloads, according to the available data) and Abstracts Views on Vision4Press platform.
Data correspond to usage on the plateform after 2015. The current usage metrics is available 48-96 hours after online publication and is updated daily on week days.
Initial download of the metrics may take a while.