Fig. 2
Download original image
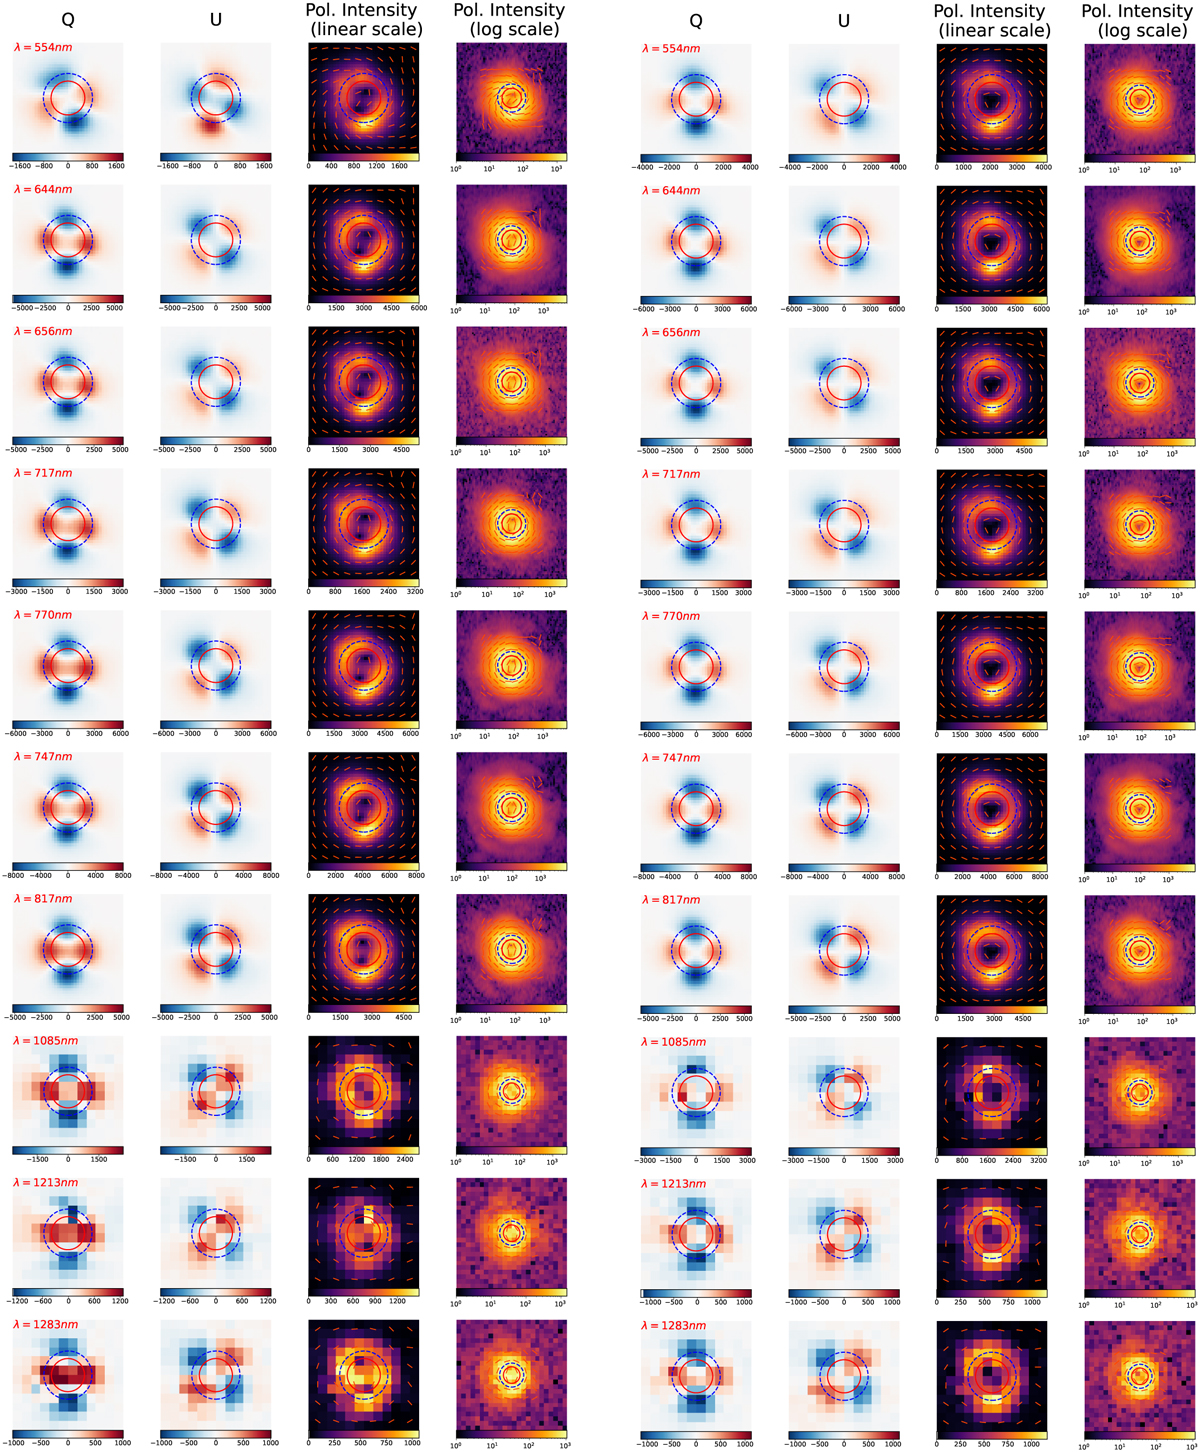
Stokes Q and U and polarized intensity images for the ten filters. The left and right parts correspond to the data before and after Qϕ and Uϕ minimizations, respectively. Red and blue circles represent the photospheric radius (22 mas; Montargès et al. 2016) and the position of the IDS in H2019 (32 mas), respectively. On the polarized intensity map, angles of polarization are marked as orange segments. North is up, and east is to the left. Units are W m−2 sr−1.
Current usage metrics show cumulative count of Article Views (full-text article views including HTML views, PDF and ePub downloads, according to the available data) and Abstracts Views on Vision4Press platform.
Data correspond to usage on the plateform after 2015. The current usage metrics is available 48-96 hours after online publication and is updated daily on week days.
Initial download of the metrics may take a while.