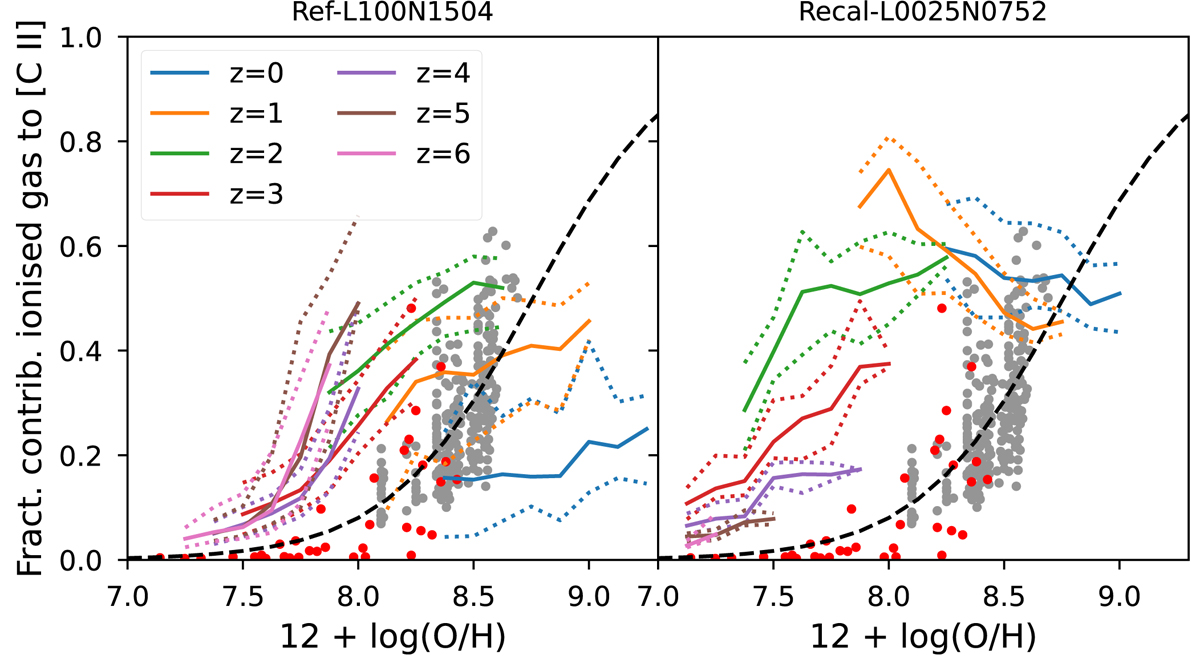
Fig. 5.
Download original image
Contribution from ionised gas phase to [C II]. Shown are the median values of the different redshifts (solid lines) and their 25th and 75th percentiles (dotted lines), and the observational data and the respective fit made by Cormier et al. (2019, black dashed line). The grey dots are the data from Croxall et al. (2017), while the red dots are from Cormier et al. (2019) at z = 0. Left panel: predictions of REF-L100N1504; Right panel: predictions of RECAL-L0025N0752. Only the bins with more than 5% of the total sample of galaxies for the respective simulation are shown.
Current usage metrics show cumulative count of Article Views (full-text article views including HTML views, PDF and ePub downloads, according to the available data) and Abstracts Views on Vision4Press platform.
Data correspond to usage on the plateform after 2015. The current usage metrics is available 48-96 hours after online publication and is updated daily on week days.
Initial download of the metrics may take a while.