Fig. 2.
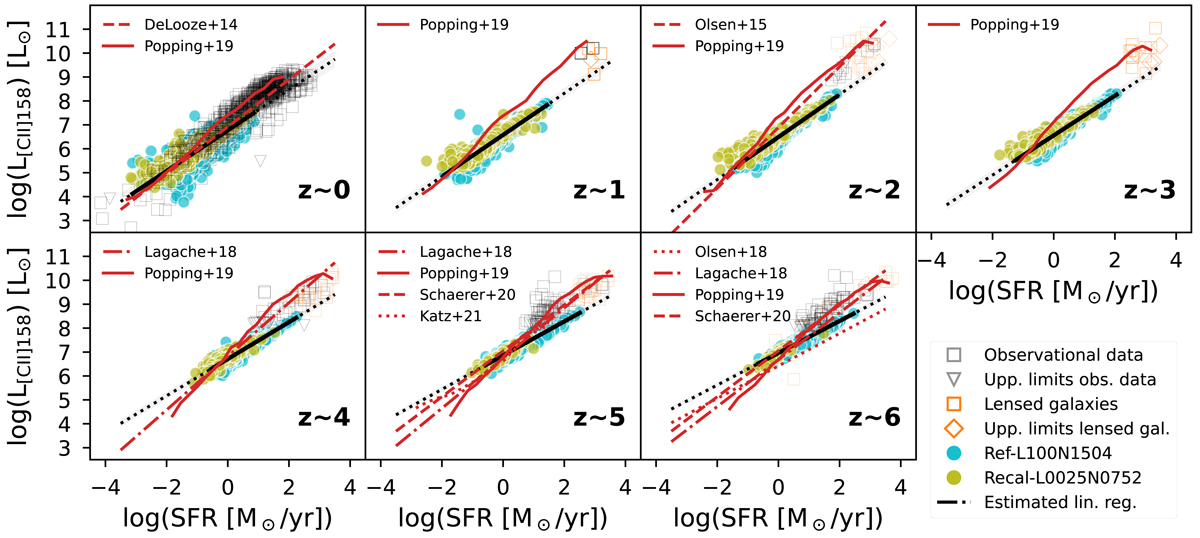
Download original image
SFR–L[C II] relation for all redshift slices used in this work. The obtained relations from the EAGLE simulations REF-L100N1504 and RECAL-L0025N0752 are compared with predictions from other simulations (Olsen et al. 2015, 2018; Katz et al. 2022), semi-analytic models (Lagache et al. 2018; Popping et al. 2019), and linear relations derived from observations (De Looze et al. 2014; Schaerer et al. 2020). The linear relations inferred from our models are shown as black solid lines over the dynamic range covered by the simulations and extrapolated (assumed to be linear) to lower and higher SFRs as black dotted lines, with the grey shaded area representing the 1σ error. Collections of observational data (Appendix A) are plotted as grey squares for detections and as grey triangles for upper limits. For lensed galaxies the symbols are plotted in orange, and the upper limits that affect both the SFR and luminosity are plotted as diamonds.
Current usage metrics show cumulative count of Article Views (full-text article views including HTML views, PDF and ePub downloads, according to the available data) and Abstracts Views on Vision4Press platform.
Data correspond to usage on the plateform after 2015. The current usage metrics is available 48-96 hours after online publication and is updated daily on week days.
Initial download of the metrics may take a while.