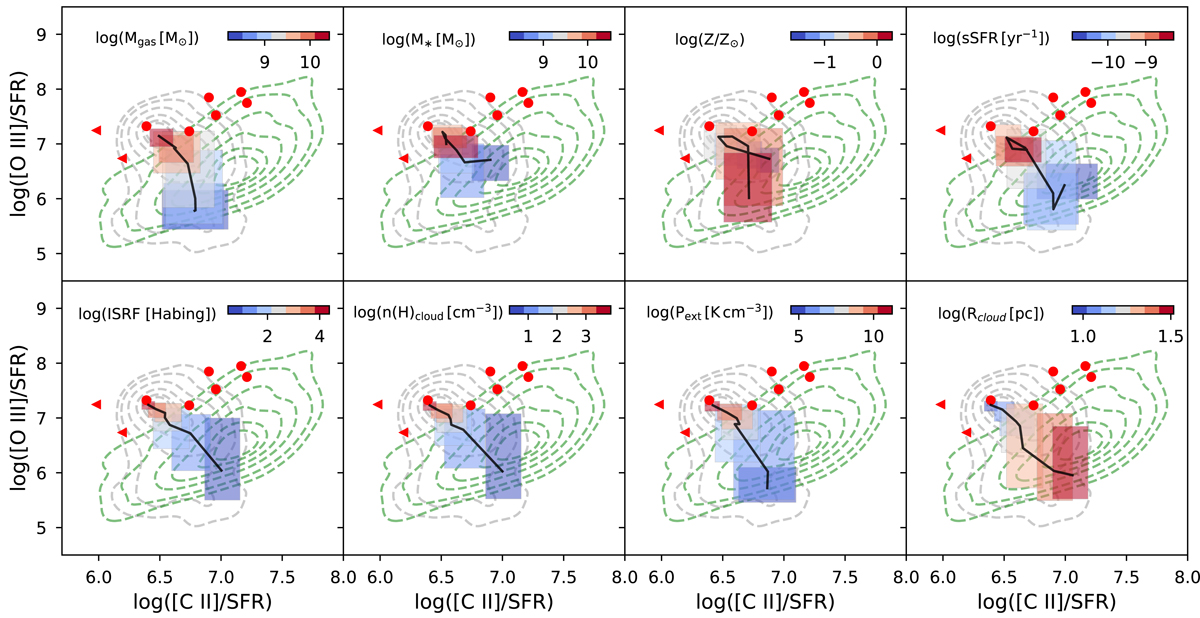
Fig. 17.
Download original image
Impact of physical parameters in L[O III]88/SFR vs. L[C II]/SFR. The RECAL-L0025N0752 model predictions combined over all redshifts are shown as as grey dashed contours and the compiled observations as green dashed contours. The colour-coded rectangles represent the area between the 25th and 75th percentiles from low (blue) to high (red) values for the given parameters: gas mass (Mgas), stellar mass (M*), metallicity (Z/Z⊙), sSFR, ISRF, total hydrogen number density in the neutral clouds (n(H)cloud), external pressure (Pext), and radius of the neutral clouds (Rcloud). The solid black lines connect the median values of each rectangle. Detections and upper limits from Harikane et al. (2020) are shown as red filled dots and triangles (as in Fig. 15), respectively.
Current usage metrics show cumulative count of Article Views (full-text article views including HTML views, PDF and ePub downloads, according to the available data) and Abstracts Views on Vision4Press platform.
Data correspond to usage on the plateform after 2015. The current usage metrics is available 48-96 hours after online publication and is updated daily on week days.
Initial download of the metrics may take a while.