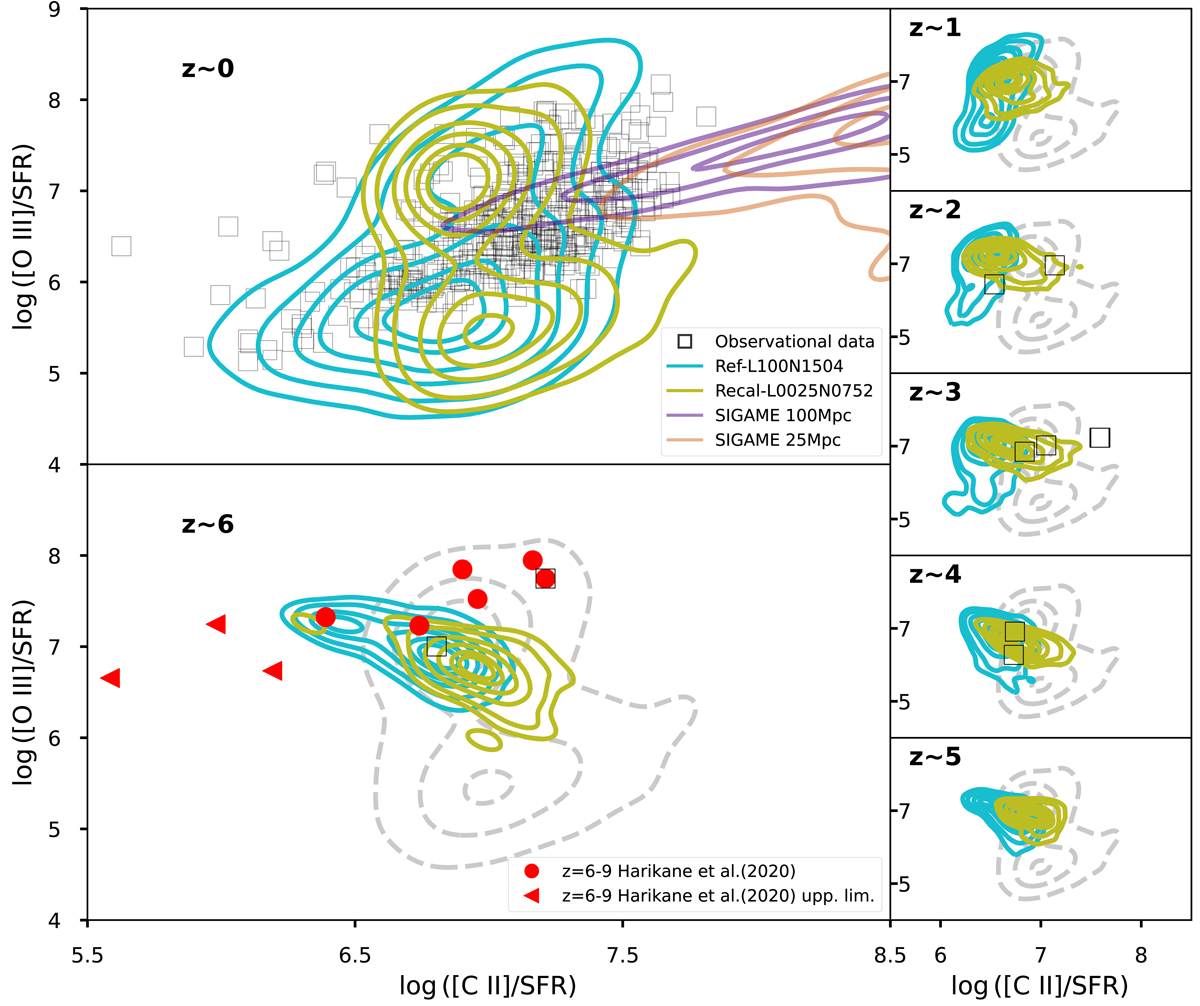
Fig. 15.
Download original image
Diagnostic diagram for L[O III]/SFR and L[C II]/SFR, similar to that presented in Harikane et al. (2020; shown as red filled dots for detections and triangles for upper limits). The cyan and olive contours show the model predictions from REF-L100N1504 and RECAL-L0025N0752. Shown is a comparison between the observational data (black squares) and the SIGAME predictions (Olsen et al. 2021) for the local Universe in 25 Mpc and 100 Mpc simulation boxes (purple and brown contours). The panels with redshifts above zero show the z = 0 RECAL-L0025N0752 estimations as grey dashed contours.
Current usage metrics show cumulative count of Article Views (full-text article views including HTML views, PDF and ePub downloads, according to the available data) and Abstracts Views on Vision4Press platform.
Data correspond to usage on the plateform after 2015. The current usage metrics is available 48-96 hours after online publication and is updated daily on week days.
Initial download of the metrics may take a while.